


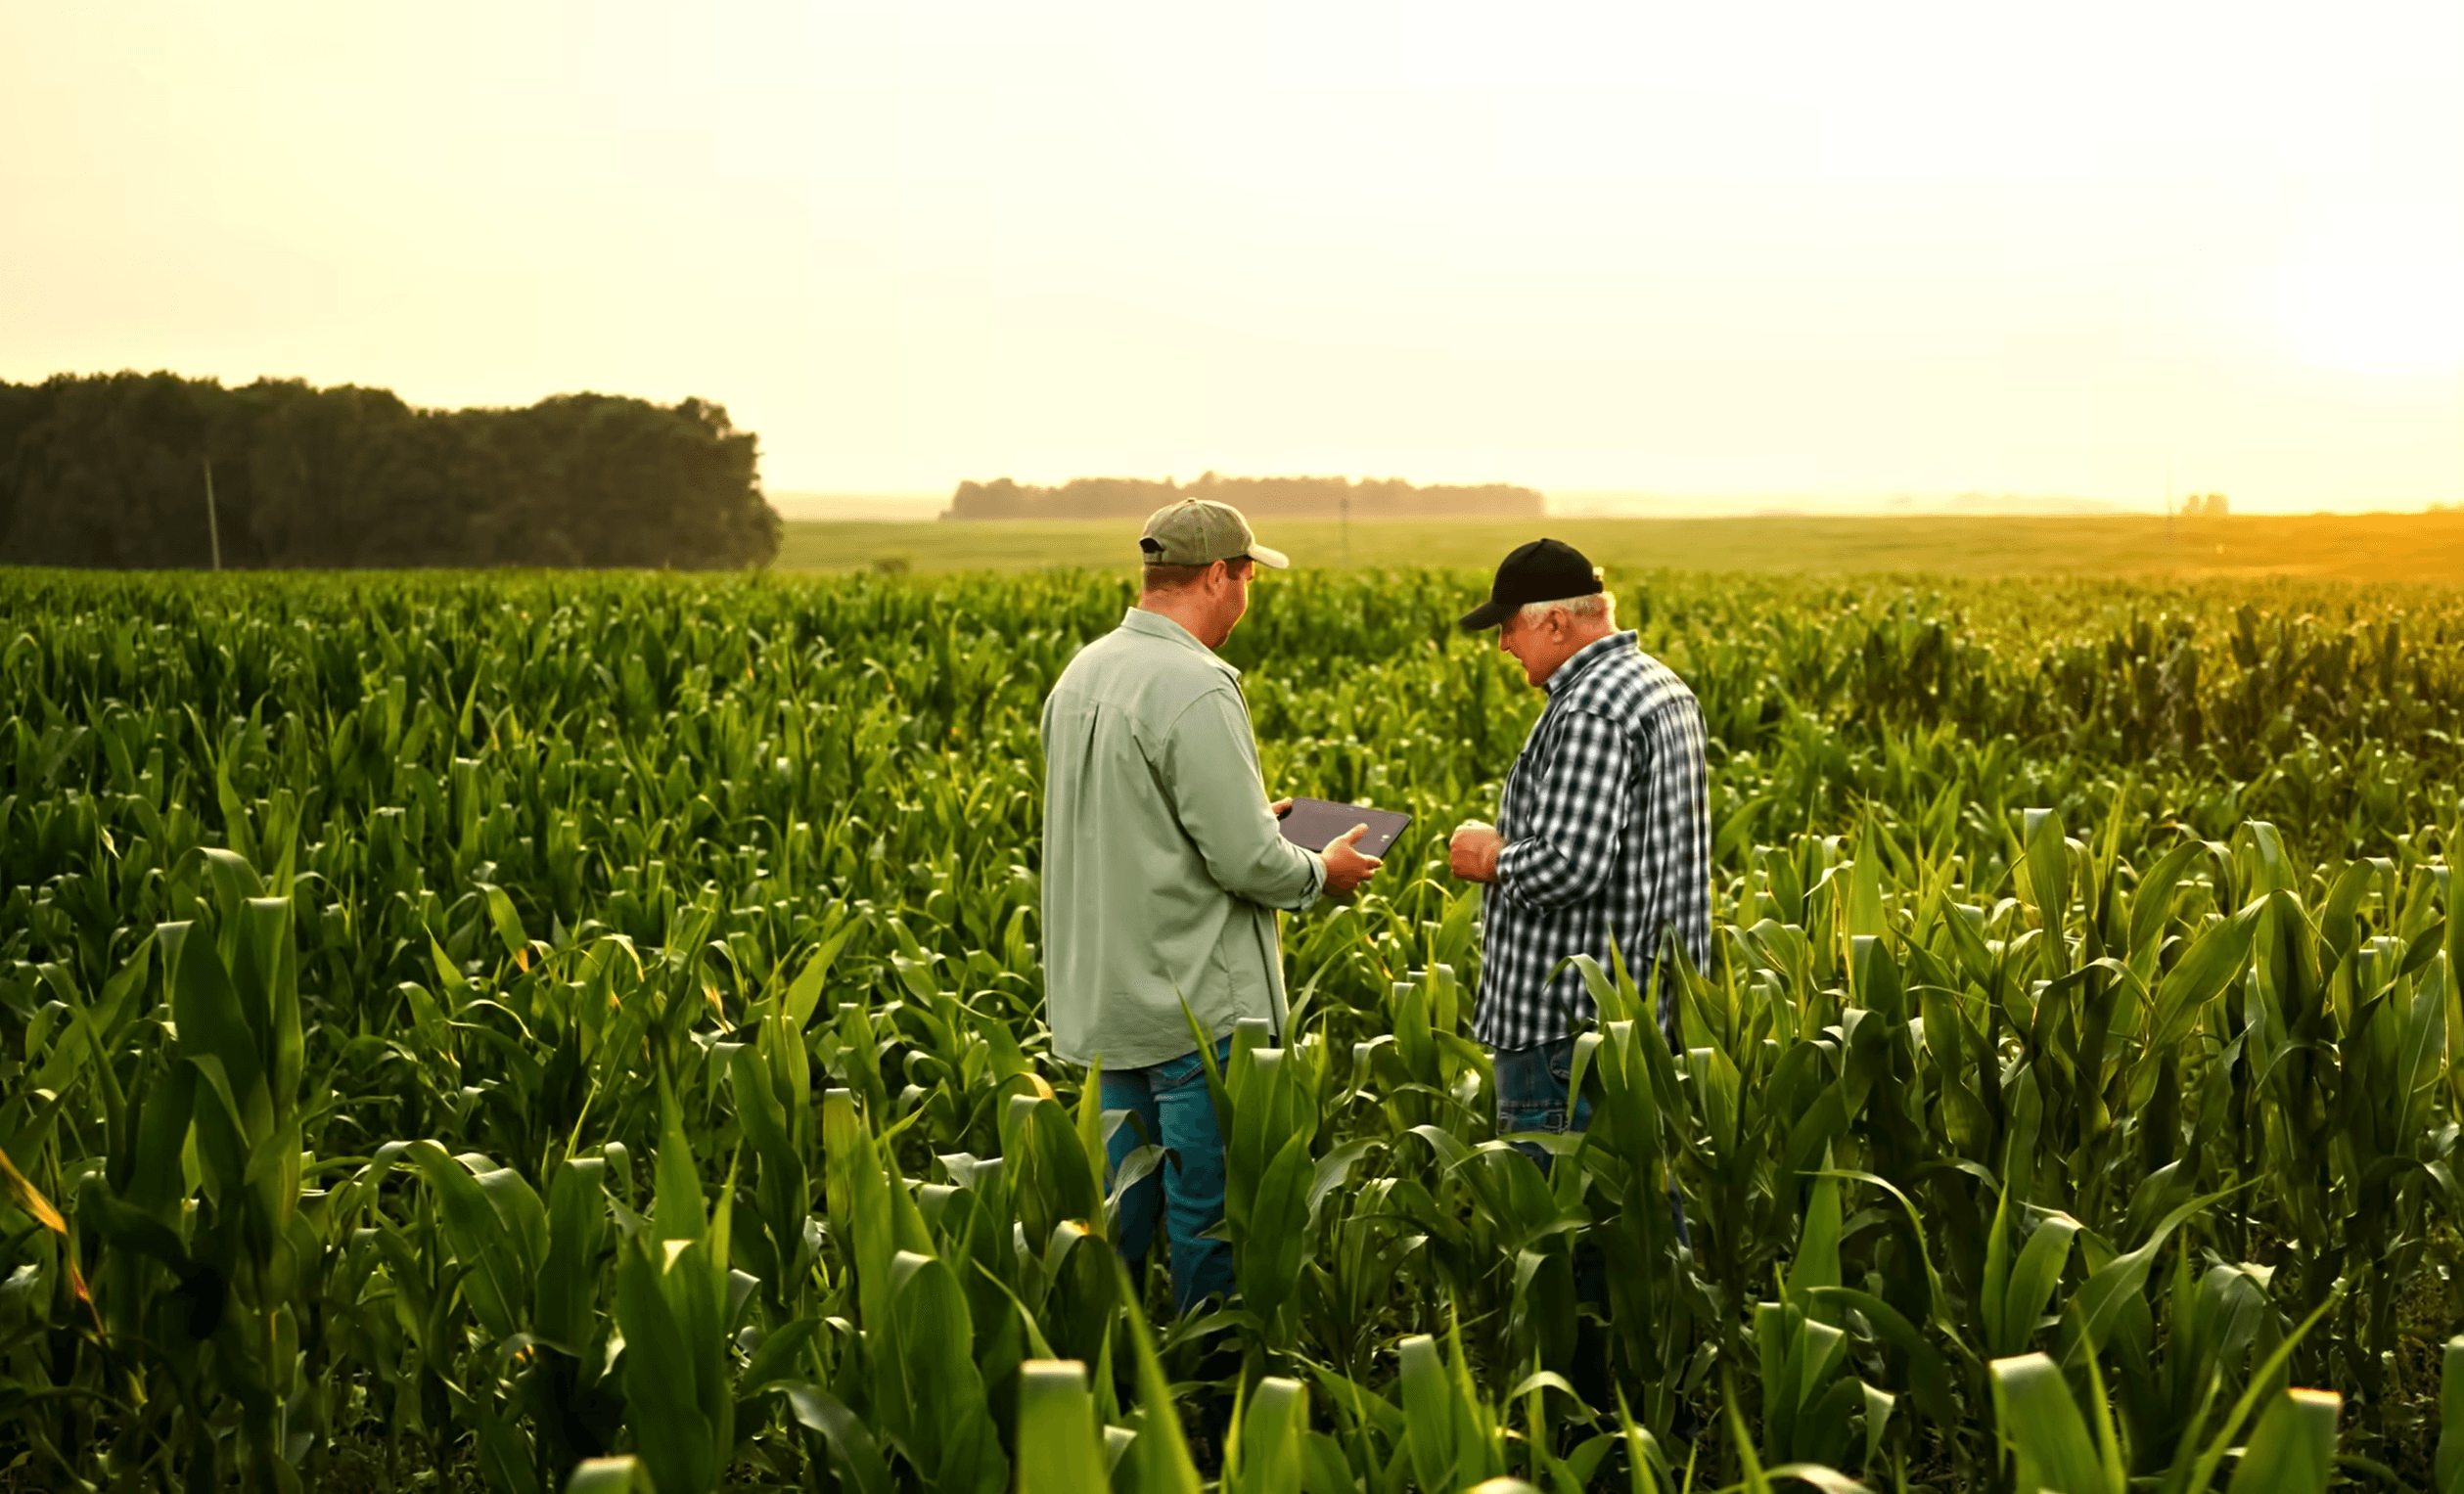
How nine sectors converge toward a $28–48 billion market ceiling — and which technologies will close the final gap
The Series in One Lens: Labor Cost Drives Everything
Nine sectors. One economic engine. Every investment dollar in agricultural robotics traces back to a single calculation: the cost of human labor versus the cost of autonomous replacement.
This series tracked weeding robots in France, strawberry harvesters in Japan, milking robots in the Netherlands, and autonomous tractors in Iowa. Each story ends with the same math.
Labor costs in OECD agriculture rose 34% between 2015 and 2024, according to ILO data. Robot unit costs fell 22% over the same period. The crossover point has arrived in high-value crops. Row crops follow by 2028.
The Western commercial market — excluding China's separate 70-million-worker domestic deployment — stood at roughly $12–14 billion in 2025. Independent analysts project $28–48 billion by 2030, depending on RaaS penetration speed and subsidy continuity.
Market Sizing: Where the Money Goes 2025–2030
Multiple research firms estimate divergent totals because they define the market differently. Grand View Research projects $48 billion by 2030. ResearchAndMarkets estimates $28 billion. Business Research Company targets $28.2 billion at 22.4% CAGR. The spread reflects uncertainty about RaaS accounting and indoor farming inclusion.
This analysis uses the conservative $28–35 billion range for the ex-China Western market. That range excludes Chinese domestic deployment, which represents a parallel universe of scale operating under different economics.
| Market Segment | 2023 ($B) | 2025E ($B) | 2028E ($B) | 2030E ($B) |
|---|---|---|---|---|
| NA Agri Robotics | 4.2 | 6.2 | 10.8 | 15.4 |
| EU Agri Robotics | 2.8 | 4.1 | 7.2 | 10.3 |
| Japan Agri Robotics | 0.9 | 1.4 | 2.5 | 3.6 |
| Israel Agtech Export | 0.4 | 0.7 | 1.3 | 2.0 |
| Total Ex-China (est.) | 8.3 | 12.4 | 21.8 | 31.3 |
Table 1: Ex-China agricultural robotics market estimates by region. All figures are analyst projections and carry significant variance. No figures are audited or independently verified.
North America leads in absolute dollar terms. Japan leads in penetration rate, driven by demographic collapse in the farm workforce. The EU accelerates through regulatory mandate rather than pure economics.
Israel punches above its size. With fewer than 50,000 commercial farms, Israel generates $700 million in agtech exports. The country exports the technology model, not just the machines.
The Technology Stack: What Changes Between 2025 and 2030
Five technology inflection points will define the next five years. None is experimental. All are commercially constrained today by cost, connectivity, or data scarcity.
Foundation AI Models Enter the Field
Agricultural AI in 2024 used narrow, task-specific models. One model detected weeds. A different model counted fruit. Each required separate training data and separate deployment.
Foundation models — large pre-trained systems fine-tuned for agriculture — began field trials in 2024. John Deere's See & Spray Ultimate uses a 36-camera vision system trained on 13 million weed images (company-disclosed, unverified by third parties).
By 2028, one foundation model will handle weed detection, disease diagnosis, yield prediction, and irrigation scheduling for a single farm. The economics shift from hardware margins to data subscription margins.
Swarm Robotics Breaks the Acreage Barrier
Single large robots face a fundamental problem: one breakdown stops the entire field. Swarm systems — fleets of 10–50 lightweight robots — solve this with redundancy.
Fendt Xaver deploys fleets of small planting robots across European wheat fields. Agrointelli Robotti handles row-crop weeding across Scandinavian farms. Both validate the core proposition: smaller robots mean lower per-task cost and higher fault tolerance.
Swarm coordination protocols remain immature. Most commercial systems require human orchestration at the fleet level. True autonomous swarm coordination — where robots negotiate task allocation dynamically — reaches commercial readiness around 2027–2028.
Digital Twins Shift from Dashboard to Decision-Maker
Digital twin technology creates real-time virtual replicas of individual farms. Sensors feed soil moisture, crop health, weather, and machine status into a live model that simulates outcomes before physical action.
The Netherlands leads deployment, with Wageningen University research programs running twin systems on commercial greenhouse operations. Dutch growers reduced fertilizer use 18% in controlled trials using twin-guided variable-rate application (university-disclosed, peer-reviewed 2024).
By 2030, digital twins become the operating system of precision farms. Robots execute tasks the twin calculates. The farmer reviews exception reports, not daily schedules.
Robot-as-a-Service Unlocks Mid-Size Farms
Capital cost remains the primary adoption barrier below 500-acre operations. A strawberry harvesting robot system costs $250,000–$400,000 (company estimates, unverified). Most mid-size farms cannot absorb that capital outlay.
RaaS platforms convert capital expenditure into operating expenditure. Carbon Robotics charges per-acre fees for LaserWeeder deployments. Naio Technologies offers seasonal lease agreements across France and Spain. These models expand the addressable market from large commercial farms to mid-tier operators.
RaaS penetration in North America reached an estimated 8–12% of deployments in 2024 (analyst estimate, not verified). That figure reaches 35–45% by 2030 as platforms mature and farm connectivity improves.
| Technology | TRL 2025 | TRL 2030E | Key Bottleneck | Lead Region |
|---|---|---|---|---|
| Foundation AI Models | 5 | 8 | Training data scarcity | USA/EU |
| Swarm Robotics | 4 | 7 | Coordination protocols | EU/Japan |
| Digital Twin Farms | 5 | 8 | Real-time data pipelines | Netherlands/Israel |
| Bio-inspired Grippers | 4 | 7 | Durability in field | USA/Japan |
| Autonomous Harvest (berry) | 6 | 9 | Gentle touch sensors | EU/USA |
| RaaS Platforms | 7 | 9 | Farm connectivity | USA/EU |
| 5G/Edge Computing | 6 | 9 | Rural infrastructure | Japan/EU |
Table 2: Technology Readiness Level (TRL) estimates for key emerging technologies. TRL scores are analyst assessments based on public research and commercial deployment evidence, not official government TRL ratings.
Regional Intelligence: Four Markets, Four Trajectories
North America: Scale Economics Win
The United States deploys robotics at scale where labor economics are most compelling. Specialty crops — strawberries, tomatoes, grapes — drive initial commercial adoption because hand-picking labor costs reach $3,000–$5,000 per acre annually.
The H-2A guest worker visa program issued 310,676 visas in 2023 but cannot fill structural shortfalls. Only 637,000 hired crop workers were counted in April 2025, according to USDA. That deficit grows each decade.
John Deere, CNH Industrial, and AGCO dominate the tractor and precision planting segment. Carbon Robotics, FarmWise, and Monarch Tractor lead the venture-backed specialist tier. USDA precision agriculture grants accelerate mid-size farm adoption but lack the scale of EU subsidies.
North America reaches 20–28% market penetration by 2030 in commercially relevant crop categories. Row-crop autonomy — corn, soybeans, wheat — crosses 15% penetration by 2028 as autonomous tractor platforms achieve price parity with supervised equivalents.
European Union: Regulation Creates the Market
The EU Farm to Fork Strategy mandates 50% pesticide reduction by 2030. That mandate is not aspiration. Non-compliant farms face CAP subsidy penalties. Robotics becomes compliance infrastructure.
The Netherlands operates as Europe's robotics laboratory. Greenhouse automation reaches 85% penetration in Dutch tomato and pepper operations. Precision weeding robots handle 60% of Dutch sugar beet hectares (USDA GAIN report 2024, estimates vary by source).
France produces Naio Technologies, Europe's leading specialized field robot company. Spain deploys drone-based crop monitoring across wine and olive operations. Germany integrates autonomous guidance into its dominant tractor OEM supply chain through Fendt and CLAAS.
EU penetration reaches 18–25% across the bloc by 2030. The gap between Northern European leaders (Netherlands, Denmark, Germany) and Southern European adopters (Spain, Italy, Greece) remains significant. Infrastructure investment determines the speed of catch-up.
Japan: Demographic Crisis Accelerates Adoption
Japan's farmer population will drop below one million by 2030, with an average age above 68. This is not a policy challenge. It is arithmetic. The farms cannot survive without automation.
MAFF's Smart Agriculture Plan funds robotic deployment across rice, fruit, and vegetable operations. Kubota's KSAS farm management system connects 100,000+ machines on a single data platform (company-disclosed, unverified). Yanmar deploys autonomous rice transplanters across Niigata prefecture.
Japan's specialty: high-value crop robotics. Companies like Inaho and FFROBOT built strawberry harvest robots specifically for Japanese greenhouse configurations. These designs export to South Korea and Australia, creating a technology export model Japan deliberately cultivates.
Japan reaches 30–38% penetration by 2030 — the highest rate among major OECD markets. The driver is pure necessity, not economics. Japan automates because no human workers remain available, regardless of ROI timelines.
Israel: The Export Technology Model
Israel operates 48,000 commercial farms but generates influence far exceeding its domestic market. Israeli agtech companies design for export from day one. Domestic deployment validates the technology. Global sales generate the revenue.
Netafim pioneered precision drip irrigation for water-scarce environments and now operates across 110 countries. Prospera Technologies (acquired by Valmont Industries 2021, deal value undisclosed) deploys AI crop diagnostics across greenhouse operations globally. CropX provides soil analytics to farms in 50+ countries.
Israel's government funds agtech through the Israel Innovation Authority, targeting water efficiency, yield optimization, and climate adaptation — all technologies with global export potential. Israeli R&D investment in agtech reached $210 million in 2024 (estimate, not audited).
The Israeli model matters because it demonstrates how small domestic markets can create globally significant technologies. Any OECD country serious about agricultural technology exports needs to study the Israeli playbook.
| Region | 2024 VC ($M est.) | Gov Subsidy | Key Driver | Penetration 2030E |
|---|---|---|---|---|
| USA | 1,200 | USDA AgTech grants | H-2A visa labor cost | 20-28% |
| EU | 780 | Farm to Fork / CAP | Green Deal mandate | 18-25% |
| Japan | 320 | MAFF Smart Agri Plan | Farmer age crisis (avg 68) | 30-38% |
| Israel | 210 | IIA R&D grants | Water scarcity / export model | 15-22% |
Table 3: Regional investment and policy landscape. VC figures are estimates from public deal announcements; government subsidy descriptions are based on published policy documents. Penetration estimates carry ±5 percentage point uncertainty.
Key Players: Who Wins the 2030 Market
Three categories of company compete for the 2030 agricultural robotics market. OEM Giants hold distribution and brand trust. Purpose-Built Specialists hold technology superiority in narrow domains. Emerging Challengers hold the AI-native architecture advantage.
The OEM Giants — John Deere, AGCO, Kubota, CNH Industrial — deploy through existing dealer networks covering millions of farms. Their competitive advantage is not the robot. It is the relationship, the service infrastructure, and the data asset accumulated from decades of precision agriculture deployment.
The Specialists win where the OEMs move too slowly. Carbon Robotics built LaserWeeder before any OEM invested seriously in high-energy laser weeding. FarmWise deployed vegetable-bed weeding robots across California before Deere recognized the commercial potential. First-mover advantage in specific crop categories creates durable positions.
The AI-native challengers — many in stealth or early commercial phase — build from foundation models down to hardware, rather than from hardware up to software. This architectural difference may prove decisive after 2027 when model capabilities surpass current task-specific systems.
| Company | HQ | Tier | 2025 Focus | 2030 Bet |
|---|---|---|---|---|
| John Deere | USA | OEM Giant | Autonomous tractors, See & Spray | Full-field AI autonomy platform |
| AGCO / Fendt | Germany/USA | OEM Giant | Xaver swarm planting | Fleet management SaaS |
| Kubota | Japan | OEM Giant | KSAS smart farming system | Elderly-farmer replacement stack |
| Carbon Robotics | USA | Specialist | LaserWeeder scale-out | RaaS weeding nationwide |
| Naïo Technologies | France | Specialist | Oz weeding robot expansion | Multi-crop autonomy EU |
| Harvest Automation | USA | Specialist | Nursery / greenhouse bots | Indoor farming automation |
| Prospera / Valmont | Israel | Specialist | AI crop diagnostics | Irrigation + analytics fusion |
| FFROBOT / Inaho | Japan | Challenger | Strawberry harvest robot | High-value crop specialist |
Table 4: Key company positioning based on publicly available information. Financial figures and deployment claims marked as company-disclosed are unverified by independent auditors.
Challenges That Limit the Ceiling
Connectivity Remains Agriculture's Infrastructure Gap
The FCC reported in 2024 that rural US areas still lack 25/3 Mbps broadband. Japan's 5G rural coverage reaches only 45% of farmland by area (MIAC estimate). EU rural broadband investment lags urban deployment by 8–12 years.
Robots can operate offline using edge computing. But disconnected systems cannot update mission plans, receive predictive alerts, or contribute data to fleet learning. Offline operation degrades the technology's full potential by roughly 40%.
Talent Gap Compounds Hardware Barriers
Deploying an autonomous tractor fleet requires agronomists who understand both soil science and machine learning. That combination is extraordinarily rare. Every agricultural robotics company reports talent as a greater constraint than capital.
Universities in Wageningen, UC Davis, Purdue, and Tokyo Agricultural University run dedicated agri-robotics programs. But graduation rates lag commercial demand by a ratio of roughly 1:5. The gap does not close before 2028.
ROI Timelines Still Disqualify Mid-Size Farms
A robotic weeding system with a 7-year payback period works for a 2,000-acre California lettuce operation. It fails the economics test for a 300-acre Dutch vegetable farm. Most of the world's commercial agriculture falls in the middle tier.
RaaS solves the capital problem but introduces service dependency risk. When Carbon Robotics' LaserWeeder is unavailable during peak weed season, the farm has no backup. Redundancy planning for service-based robotics remains undeveloped.
The 2030 Forecast: Penetration Toward the Ceiling
This series tracked agricultural robotics from 10–23% current penetration across commercially relevant crop categories in OECD markets. The ceiling is not 100%. A substantial share of global agriculture — smallholder farms under 5 hectares, terrain-limited operations, subsistence farming — will not automate in this decade.
The realistic addressable ceiling for the Western ex-China commercial market sits at 55–65% penetration over a 15-year horizon. By 2030, the sector reaches 25–35% of that ceiling, concentrated in the highest-labor-cost operations: specialty fruits, vegetables, dairy, and large-scale row crops.
The investment thesis remains intact and compelling. Labor cost replacement is not cyclical. Demographic aging in OECD farm workforces accelerates. Climate volatility increases the value of precision over volume. Every factor that made agricultural robotics attractive in 2020 is more acute in 2025.
The companies that survive to capture the 2030 market share one characteristic: they understand they are selling labor cost reduction, not robots. The machine is incidental. The economic outcome is the product.
Series Conclusion: The Most Significant Agricultural Transformation in 150 Years
Nine articles. Nine sectors. The same conclusion repeats.
Weeding robots replace $28-per-hour hand weeders. Harvesting robots replace seasonal pickers who cost $3,000–$5,000 per acre. Milking robots replace dairy workers who aged out of the workforce. Autonomous tractors replace operators who retired without successors.
Agricultural mechanization began with the steam thresher in the 1870s. Each wave eliminated specific forms of human drudgery and replaced them with capital equipment. This wave differs in one crucial respect: it eliminates cognitive labor, not just physical labor.
The robots in this series see, think, decide, and act. They identify individual weeds by species, assess individual strawberries by ripeness, diagnose individual cows by gait. That cognitive specificity is the inflection point that separates 2025 agriculture from every prior mechanization wave.
The transformation is not complete. Connectivity gaps, talent shortages, and capital barriers slow deployment. But the economic logic is irreversible. Wherever labor costs exceed robot deployment costs, automation follows. Labor costs rise every year. Robot costs fall every year.
The gap between those two curves is the agricultural robotics market. It closes until automation saturates the addressable ceiling. By 2030, the sector captures roughly $28–35 billion in annual Western commercial revenue, employs more skilled technicians than it displaces seasonal workers, and produces food with measurably less chemical input and water use than the operations it replaces.
That outcome is not guaranteed by technology. It is guaranteed by economics. And economics does not reverse.
Data Integrity Notice
* VC investment figures are estimates based on publicly available deal announcements and analyst aggregations; not independently verified by third-party auditors. Company-disclosed deployment statistics are unverified unless noted.
Market size projections sourced from Grand View Research, Business Research Company, MarketsandMarkets, and ResearchAndMarkets. Divergent estimates reflect different market definitions and methodology. Readers should treat all forward projections as directional, not precise. Nothing in this series constitutes investment advice.
Agricultural Robotics Research Series:
Part 1: Labour Crisis — How Robots Will Fill the Global Agricultural Workforce Gap
Part 2: Agricultural Robotics | Market Leaders, Regional Analysis & Top Countries
Part 3: Agricultural Robotics | $34B Weeding Robot Market
Part 4: Agricultural Robotics | Harvesting Robots: $6.9B Market
Part 5: Agricultural Robotics | Precision Planting & Seeding
Part 6: Agricultural Robotics: Crop Monitoring and Aerial Scouting
Part 7: Dairy & Livestock Automation
Part 8: Autonomous Tractors & Field Machines
Part 9: Post-Harvest Automation — Sorting, Grading & Cold Chain
Part 10: Future Trends 2025–2030






Leave a comment