


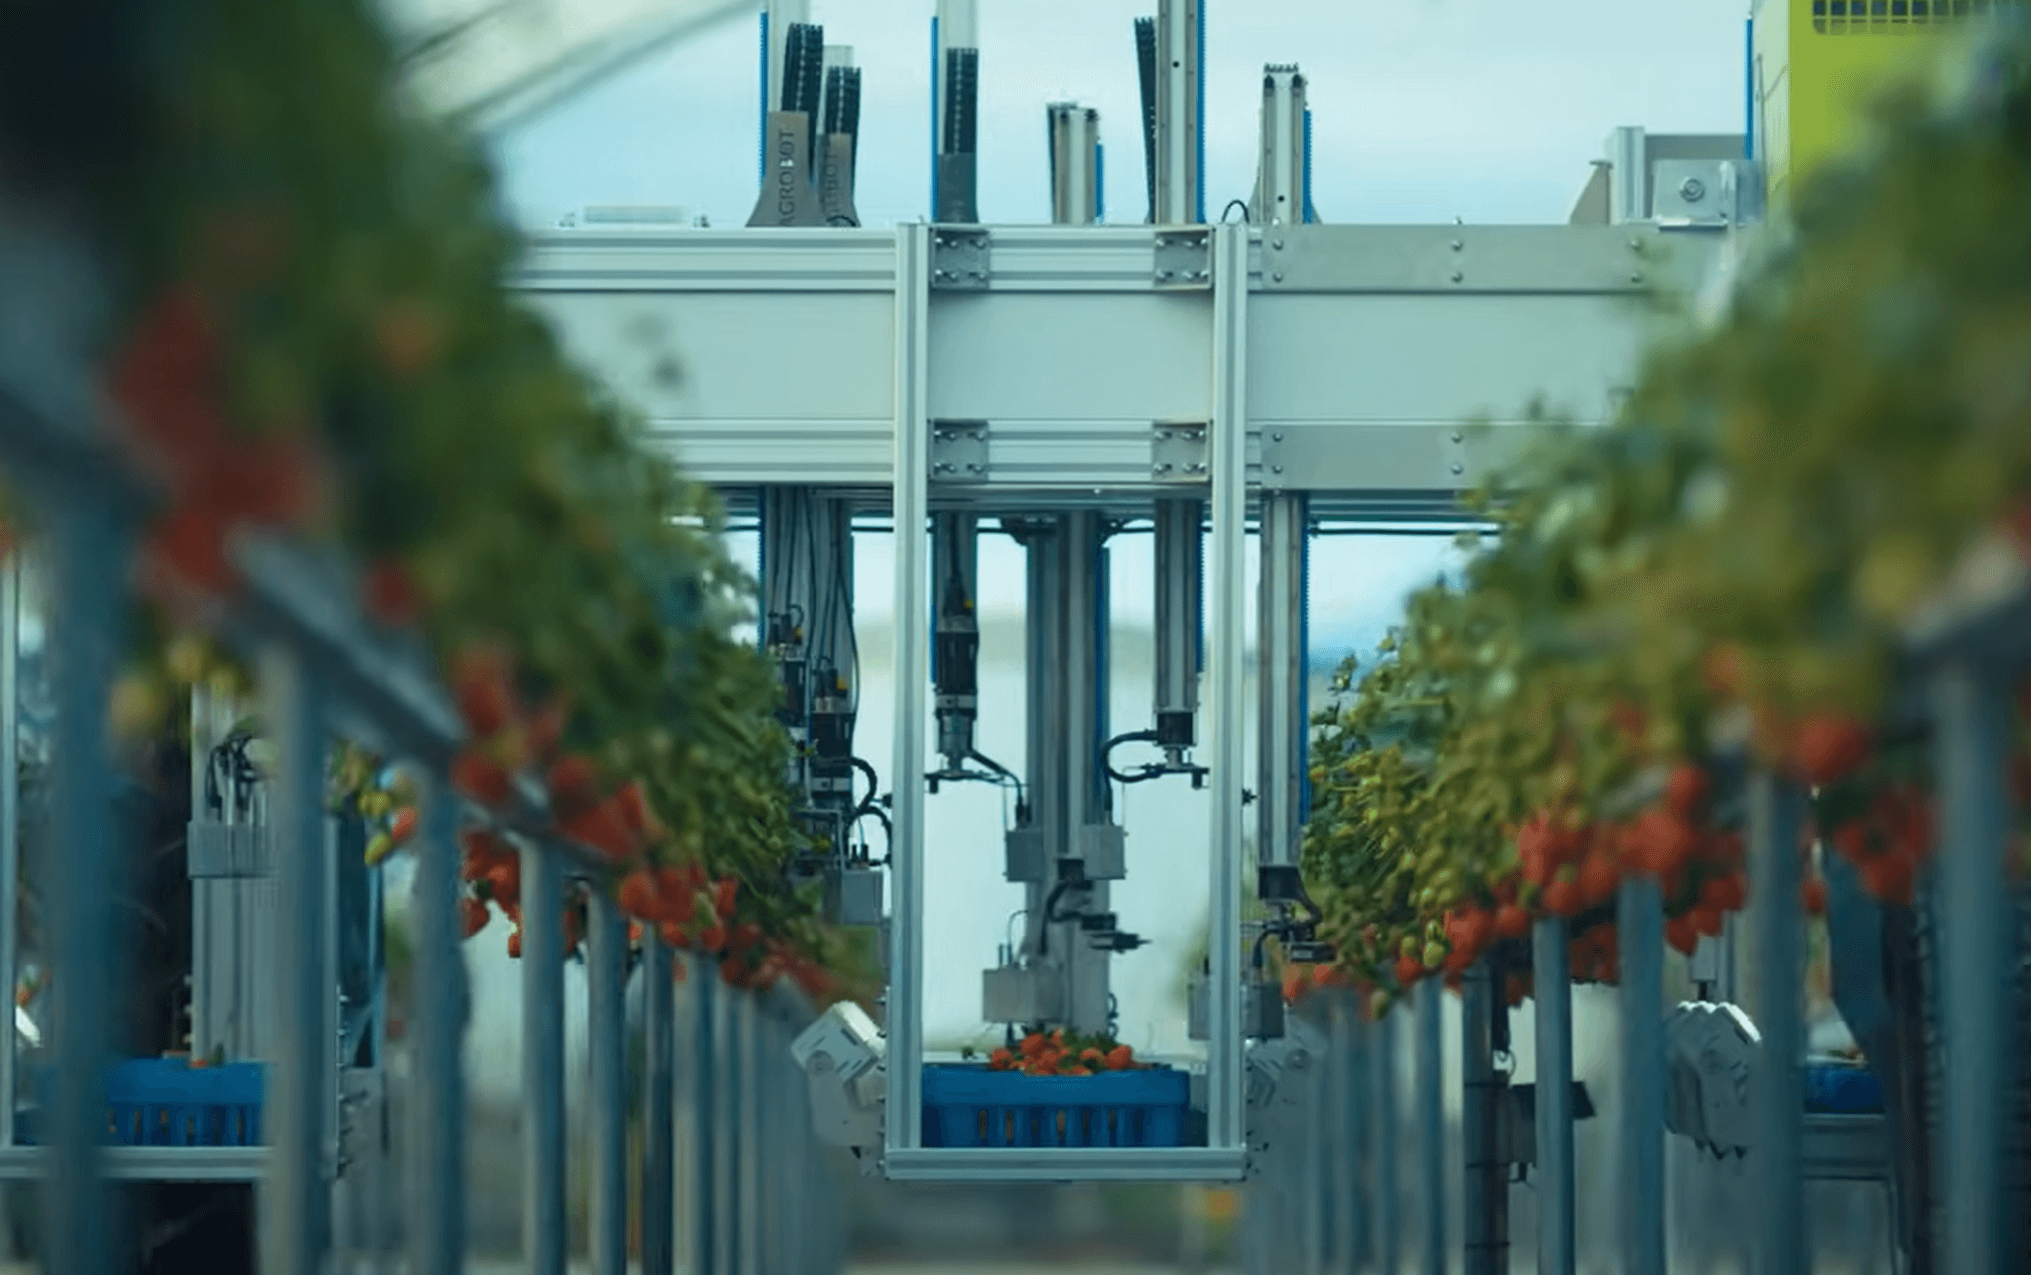
AGRICULTURAL ROBOTICS | Harvesting Robots: A $6.9 Billion Market and the Last Frontier of Farm Automation
The global harvesting robot market reached $2.24 billion in 2024. It is heading to $6.93 billion by 2030. The addressable hand-harvesting labor cost is $50 billion. Robots capture less than 5% of it. Here is the full picture — market, players, technology, and economics.
Agricultural Robotics Research Series | March 2026 | Western Commercial Market (US, EU, Australia)
Introduction
Harvesting is the last great unsolved problem in agricultural robotics. Planting, spraying, and weeding robots operate at commercial scale. Harvesting robots still struggle with tasks humans master in days.
The reason is physics. Fruit grows at variable angles, occluded by leaves, on stems requiring precise detachment force. Computer vision identifies ripe targets reliably. Reaching, grasping, and removing without bruising remains mechanically hard.
The global market hit $2.24 billion in 2024 — yet captures less than 5% of the $50 billion annual hand-harvesting labor cost [1]. That gap is the entire investment thesis. This analysis covers the verified market size, regional deployment, key players, emerging technologies, the economics of ownership, and the honest barriers still limiting scale. China is excluded: its state-directed ecosystem is structurally separate and analyzed in a dedicated series [2].
Market Opportunity: Verified Numbers
Five research firms independently track this market. Their size estimates diverge — methodology differs — but their direction is unanimous: 17–22% annual growth through 2030 [1][3][4][5][7]. That is among the fastest sustained growth rates in any agricultural segment.
North America holds 36–41% of the global market in 2024 [1][5]. Europe ranks second at ~30%. The Western commercial segment (US and EU combined) represents $1.4–1.8 billion in deployed robots against $28–34 billion in unautomated hand-harvesting labor costs [6]. The penetration gap is the opportunity.
Market Opportunity: Verified Numbers
Five research firms independently track this market. Their size estimates diverge — methodology differs — but their direction is unanimous: 17–22% annual growth through 2030 [1][3][4][5][7]. That is among the fastest sustained growth rates in any agricultural segment.
North America holds 36–41% of the global market in 2024 [1][5]. Europe ranks second at ~30%. The Western commercial segment (US and EU combined) represents $1.4–1.8 billion in deployed robots against $28–34 billion in unautomated hand-harvesting labor costs [6]. The penetration gap is the opportunity.
| Market Source | 2024 Estimate | 2030 Projection | CAGR |
|---|---|---|---|
| Grand View Research [1] | $2.24B (global) | $6.93B | 21.9% |
| Business Research Co. [3] | $1.4B (2025 base) | $3.09B | 17.0% |
| Coherent Market Insights [4] | $2.56B (2025 base) | $10.36B (2032) | 22.1% |
| DataM Intelligence [7] | $1.32B (2022 base) | $3.33B | ~17% |
| Western market only (est.) [6] | ~$1.4–1.8B | ~$4.5–6.0B | ~20% |
Table 1: Market size estimates across five research sources. Ranges and growth trajectory are more reliable than point estimates; scope definitions vary. [1][3][4][5][7]
Strawberries and soft fruit are the primary commercial deployment target — 400–500 person-hours per acre, consistent raised-bed geometry, predictable detachment. Apples and tree fruit carry the largest total labor cost but require solving canopy access and multi-pass scheduling problems that are roughly 3 years behind berry deployment.
| Crop | US Harvest Labor Cost [6] | Hours/Acre | Robot Status | Key Challenge |
|---|---|---|---|---|
| Strawberries | $4,200–6,800/acre | 400–500 | Commercial (CA, FL, Spain) | Multi-pass scheduling |
| Raspberries | $3,800–5,500/acre | 380–460 | UK/EU trials | Soft fruit bruising |
| Asparagus | $3,400–5,100/acre | 320–420 | R&D phase | Ground-level access |
| Table Grapes | $2,100–3,500/acre | 200–300 | Pilot scale | Cluster geometry |
| Blueberries | $1,800–3,200/acre | 180–250 | Pilot to commercial | Bush height variation |
| Apples | $1,400–2,200/acre | 150–200 | Early commercial | Canopy occlusion |
| Citrus | $900–1,600/acre | 80–130 | R&D phase | Rough terrain + weight |
Table 2: Crop-level labor cost and robot readiness. Source: USDA ERS Fruit and Tree Nuts Outlook 2023 [6]; UC Davis Agricultural Issues Center [8]. Western commercial market only.
Regional Deployment: Where Robots Are Working
North America (36–41% share) is led by California, where labor hits 40% of specialty crop production costs [5]. The USDA Rural Development program committed $2.8 billion to agricultural modernization in 2024 [5]. California's Specialty Crop Block Grant offers up to 50% cost-sharing for qualifying robotic systems [5]. Two-thirds of the US strawberry industry has invested directly in Harvest CROO Robotics [11].
Europe (~30% share) is accelerating via policy. The EU's Common Agricultural Policy allocated €10.9 billion for agricultural digitalization 2021–2027 [5]. Belgium's agri-food robotics adoption doubled — from 11% to 20% — in a single year (2023–2024) [3]. CNH Industrial committed €50 million to a new Polish harvesting robot factory in March 2024 [12]. The Netherlands leads greenhouse robotics globally, with 35–40% labor productivity gains over manual operations [5].
Australia (disproportionate weight in Western totals) allocated AUD $328 million for agricultural innovation in 2024 [5]. High wages and large farm sizes make the ROI case cleaner than fragmented European markets.
| Region | 2024 Share | Key Policy Driver | Primary Deployment Crops |
|---|---|---|---|
| North America [1][5] | 36–41% | USDA $2.8B modernization; CA 50% cost-share | Strawberries, apples, blueberries |
| Europe [5][9] | ~30% | EU CAP €10.9B digitalization 2021–27 | Strawberries, tomatoes, grapes |
| Asia-Pacific ex-China [5] | ~15–18% | AU: AUD $328M innovation fund | Apples, citrus, greenhouse crops |
Table 3: Regional market share and primary policy drivers, 2024. Western market (US, EU, Australia) = ~$1.4–1.8B of global total. [1][5][9]
Key Players: Three Competitive Tiers
Tier 1 is the OEM giants — John Deere, CNH, AGCO, Kubota — building toward harvesting through acquisition and partnership. None is yet picking strawberries commercially. All are buying their way toward that capability. Blue River (Deere) and Bosch announced an AI-harvesting integration in October 2024 [12]. Kubota acquired Bloomfield Robotics in September 2024 for crop monitoring data [11]. CNH's Polish factory is the most direct harvesting bet in this tier [12].
Tier 2 is where fruit is actually being picked today. Ten purpose-built platforms cover the main commercial segments:
| Company | Crop Focus | Technology | Accuracy / Rate | Status 2025 |
|---|---|---|---|---|
| FFRobotics [11] | Apples, citrus | 24-arm suction gripper | 85–90%; 10–12K/hr | Commercial US/EU |
| Harvest CROO [11] | Strawberries | Bridge robot, vision arms | ~80%; 1 acre/day | Commercial US pilots |
| Advanced Farm Tech [11] | Berries, peppers | BerryBot CV arm | 80–85%; 1M+ lbs 2023 | Commercial CA & Spain |
| Agrobot [14] | Strawberries | Multi-arm + ripeness AI | 82–88%; ~3,600/hr/module | Commercial EU & US |
| Tevel Aerobotics [13] | Stone fruit, apples | Flying drones (Alpha-bot, 8 units) | 24/7 ops; commercial | US (CA), Italy, Chile |
| Octinion / TOMRA [14] | Strawberries | Soft-touch tactile gripper | 95%+; ~6,000/hr | Supply-chain integrated |
| Tortuga AgTech [17] | Strawberries, grapes | Single arm, CV, mobile | 98% claimed accuracy | Pilot scale |
| FieldWork Robotics [4] | Raspberries, broccoli | AI arm, mobile platform | ~70%; 1 pick/2–3 sec | UK/EU trials |
| Dogtooth Tech [14] | Strawberries (greenhouse) | Rail-mounted system | Greenhouse-optimised | EU commercial trial |
| MetoMotion [14] | Tomatoes (greenhouse) | GRoW robot, arm + vision | Greenhouse tomatoes | EU pilot |
Table 4: Tier 2 harvesting robot specialists. Performance data from company disclosures and independent field trial reports [4][11][13][14][17].
Tevel Aerobotics is the structural outlier. Its Alpha-bot deploys eight drone arms tethered to a ground cart — flying into the canopy to pick peaches, nectarines, plums, and apples. It operates commercially in California (HMC Farms partnership), Italy, and Chile [13]. Flying drones solve the canopy occlusion problem that all ground-based systems work around. The trade-off: battery life, wind sensitivity, and tethered control complexity.
Tier 3 challengers attack gaps the specialists have left: Ripe Robotics (Australia, cost-reduction focus), Muddy Machines (UK, asparagus — highest-value untouched segment), SIZA/TOOGO (France, commercial launch 2025 for vegetables and beet) [4][12][14].
Emerging Technologies: Beyond Standard Computer Vision
Three advances are redefining what the next product generation can do.
Hyperspectral and 3D sensing. Hyperspectral cameras detect internal fruit quality — sugar, bruising, moisture — not just external color. Solid-state LiDAR cost dropped 90% since 2020, falling below $1,000 per unit by late 2024 [10]. Most new platforms launching in 2025–26 integrate both. Together they eliminate the two primary failure modes of current systems: picking unripe fruit and colliding with hidden stems.
Soft robotics and tactile sensing. Conventional rigid grippers bruise or drop. Octinion's commercial soft-touch system already matches human bruising rates at 95% pick accuracy [14]. Research published in Nature npj Flexible Electronics (August 2025) demonstrated artificial skin detecting fruit ripeness, firmness, and sugar through touch — laboratory-stage, but directly targeting the last unresolved handling problem [16].
Autonomous fleet AI. Each robot generates terabytes of field data per season. Orchard Robotics raised $22 million in September 2025 specifically to build ripeness-prediction models that schedule robot fleets across multi-pass harvesting windows [10]. Solinftec's autonomous docking station (August 2024) enables fully continuous operation without manual intervention [4]. The emerging model is AI-managed robot fleets — not individual machines making independent decisions.
| Technology | Current Status | Key Data Point | Commercial Timeline |
|---|---|---|---|
| Hyperspectral ripeness sensing [15] | Integrating now | Cost viable; most new platforms 2025–26 | Standard by 2026 |
| 3D LiDAR spatial mapping [10] | Deploying now | 90% cost drop; under $1,000/unit (2024) | Mainstream 2025–26 |
| Soft robotic grippers [14] | Early commercial | Octinion: 95% accuracy, human bruise parity | Widespread by 2027 |
| Tactile artificial skin [16] | Lab / prototype | Nature npj 2025: ripeness + firmness via touch | Commercial 2028–30 |
| Autonomous fleet AI [10] | Early deployment | Orchard Robotics $22M raise Sep 2025 | Full deployment 2026–27 |
| Drone harvesting [13] | Limited commercial | Tevel operational in 3 countries | Broader scale 2027+ |
Table 5: Emerging harvesting technologies and commercial timelines. Sources: [10][13][14][15][16].
The Economics: When the Robot Pays
California and Western Europe have already crossed the economic break-even threshold: autonomous harvesters become cost-competitive once hourly labor costs exceed $18 [10]. California passed that mark in 2022. Western Europe in 2023.
A strawberry harvesting robot costs $200,000–350,000 to purchase. Annualized capital plus maintenance runs $68,000–130,000 per year. A 25-worker crew over a 12-week strawberry season costs $237,500–335,000 in total loaded costs — wages plus H-2A housing, transport, and fees at $28–35 per worker-hour [6]. The robot wins at scale, with full payback in 4–5 years at current California rates — compressing to 3 years if the minimum wage reaches $25 by 2027 [6].
| Cost Line | Human Crew (25 workers) | Harvesting Robot | Net Advantage |
|---|---|---|---|
| Labor wages (12-week season) [6] | $180,000–240,000 | $0 | Robot: full savings |
| H-2A housing, transport & fees [6] | $42,500–70,000 | $0 | Robot: full savings |
| Capital cost (annualized) [6] | $0 | $48,000–90,000 | Human advantage |
| Supervision & management | $15,000–25,000 | $8,000–15,000 | Robot slight edge |
| Maintenance & repair [6] | $0 | $20,000–40,000 | Human advantage |
| Total annual cost | $237,500–335,000 | $76,000–145,000 | Robot wins at scale |
Table 6: Human crew vs. robot TCO, 12-week strawberry season. H-2A total employer cost averages $28–35/hr. Robot capital amortized 7 years at 5%. [6][8]
RaaS pricing removes the capital barrier entirely. Harvest CROO and Advanced Farm Tech offer per-acre contracts at $300–500/acre [11]. Growers pay only for acres harvested. Machine downtime becomes the provider's problem. The model works for operations above 150–200 acres — covering most commercial strawberry farms in California, Florida, and Spain.
| Model | Per-Acre Cost | Break-Even Scale | Risk Bearer |
|---|---|---|---|
| RaaS — Harvest CROO [11] | $350–450/acre | 200+ acres | Provider |
| RaaS — Advanced Farm Tech [11] | $300–500/acre | 150+ acres | Provider |
| RaaS — FFRobotics lease [11] | $180–280/acre | 300+ acres | Provider |
| Outright purchase | $76,000–145,000/yr* | 400+ acres | Grower |
| Cooperative ownership | $30,000–60,000/yr* | 200+ acres combined | Shared |
Table 7: Harvesting robot acquisition models. *Annualized capital + maintenance. RaaS pricing from company disclosures [11][6].
What Still Does Not Work
Pick rate under closed canopy is the primary barrier. Dense foliage blocks cameras. Arms collide with stems. Current ground systems handle open-row strawberry fields well. Closed-canopy trees remain hard. Tevel's drone approach attacks this directly. Every other platform works around it.
Gentle handling at commercial speed is unsolved for the softest crops. Octinion is closest — 95% accuracy, human bruise parity — but at lower throughput than rigid-gripper systems [14]. Speed and gentleness remain in tension.
Multi-pass scheduling is where robot AI underperforms human judgment most visibly. Skilled pickers assess which rows to prioritise across a 4–6 week season intuitively. Current robot scheduling systems remain 3–5 days less accurate than expert human assessors on ripeness prediction [10].
The 2030 Outlook
Pick success rates improve 3–5 percentage points per year as training data accumulates [1][5]. Sensor costs keep falling. The 17–22% CAGR consensus across five research firms points to a Western commercial market of $4.5–6.0 billion by 2030. Greenhouse cultivation is the fastest subsegment at 24.3% CAGR — controlled environments suit current robot capabilities best [5].
| Crop Segment | 2024 Western Market | 2030 Projection | Key Milestone |
|---|---|---|---|
| Strawberries & soft fruit [1][5] | ~$320M | $1.8–2.6B | 90% pick rate by 2027 |
| Greenhouse crops [5] | ~$450M | $1.5–2.2B | Fastest: 24.3% CAGR |
| Apples & tree fruit [1][5] | ~$280M | $1.4–2.0B | 85% pick rate by 2028 |
| Grapes — table & wine [1] | ~$120M | $0.8–1.2B | EU commercial scale 2026 |
| Blueberries [5] | ~$80M | $0.5–0.8B | Full RaaS coverage 2025–26 |
| Emerging (asparagus, raspberry) [5] | ~$50M | $0.4–0.7B | Commercial entry 2027–28 |
Table 8: Western commercial harvesting robot market by crop segment. Derived from Grand View Research [1], Emergen Research [5], and crop-level deployment data synthesis.
The Bottom Line
The harvesting robot market is real, growing fast, and still early. Under 5% penetration of addressable labor spend means the entire growth story is still ahead of us.
North America and Europe will sustain 20%+ annual growth through 2030. Government subsidies in both regions are actively accelerating adoption. Labor economics crossed break-even in 2022–23 and keep improving for robots.
The platforms that will win are not necessarily the best engineers. They are the ones with the most field data, the broadest service networks, and the fastest software iteration cycles. Harvest CROO's model — two-thirds of the US strawberry industry as co-investors — is the template. Aligned incentives between grower and developer eliminate the adoption friction that kills most AgTech startups.
Asparagus and citrus remain entirely uncontested by any commercial robot. Asparagus alone carries $3,400–5,100 per acre in annual hand-harvesting costs. Whoever solves ground-level access for asparagus wins a large, undefended segment. That is where the next wave of capital should go.
Part 5 examines precision planting and seeding robots — where the market is more mature, economics are cleaner, and John Deere's dominant position faces its first credible challenge.
REFERENCES & DATA SOURCES
All market figures refer to the Western commercial segment (US, EU, Australia) unless explicitly noted as global.
[1] Grand View Research. Harvesting Robots Market Size, Share & Trends Analysis Report 2024–2030. San Francisco, 2024. https://www.grandviewresearch.com/industry-analysis/harvesting-robots-market-report
[2] China exclusion rationale: China's $80–150B state-directed agricultural robotics ecosystem operates through separate procurement, domestic manufacturers, and subsidy structures. Combining Western and Chinese data obscures both markets.
[3] The Business Research Company. Harvesting Robot Global Market Report 2026. London, January 2026. https://www.einpresswire.com/article/885148011. (Belgium 11%→20% adoption data cited within.)
[4] Coherent Market Insights. Harvesting Robot Market Trends, Share and Forecast 2025–2032. 2025. https://www.coherentmarketinsights.com/industry-reports/harvesting-robot-market. (Solinftec docking station Aug 2024; FieldWork Robotics funding; SIZA TOOGO launch.)
[5] Emergen Research. Harvesting Robots Market Size, Share & Emerging Trends 2024–2034. October 2025. https://www.emergenresearch.com/industry-report/harvesting-robots-market. (Regional shares, policy funding, greenhouse CAGR, small farm CAGR.)
[6] USDA Economic Research Service. Fruit and Tree Nuts Outlook FTS-369, September 2023. USDA NASS Farm Labor Survey 2019–2024. UC Davis Agricultural Issues Center cost studies 2023. H-2A loaded cost ($28–35/hr) from DOL disclosure data.
[7] DataM Intelligence. Global Harvesting Robots Market Report AG7927. October 2024. https://www.datamintelligence.com/research-report/harvesting-robots-market
[8] UC Davis Agricultural Issues Center. Costs and Returns for Specialty Crop Production in California. 2023 Edition.
[9] Mordor Intelligence. Agricultural Robots Market 2024–2031. https://www.mordorintelligence.com/industry-reports/agricultural-robots-market. (Regional shares; $18/hr break-even threshold for autonomous harvesters.)
[10] Mordor Intelligence [9]; additional sources: LiDAR cost decline data confirmed across automotive sector reporting. Orchard Robotics $22M Series A: September 2025 (multiple news sources). NSF-NIFA joint agricultural robotics initiative: May 2024.
Agricultural Robotics Research Series:
Part 1: Labour Crisis — How Robots Will Fill the Global Agricultural Workforce Gap
Part 2: Agricultural Robotics | Market Leaders, Regional Analysis & Top Countries
Part 3: Agricultural Robotics | $34B Weeding Robot Market
Part 4: Agricultural Robotics | Harvesting Robots: $6.9B Market
Part 5: Agricultural Robotics | Precision Planting & Seeding
Part 6: Agricultural Robotics: Crop Monitoring and Aerial Scouting
Part 7: Dairy & Livestock Automation
Part 8: Autonomous Tractors & Field Machines
Part 9: Post-Harvest Automation — Sorting, Grading & Cold Chain
Part 10: Future Trends 2025–2030






Leave a comment