


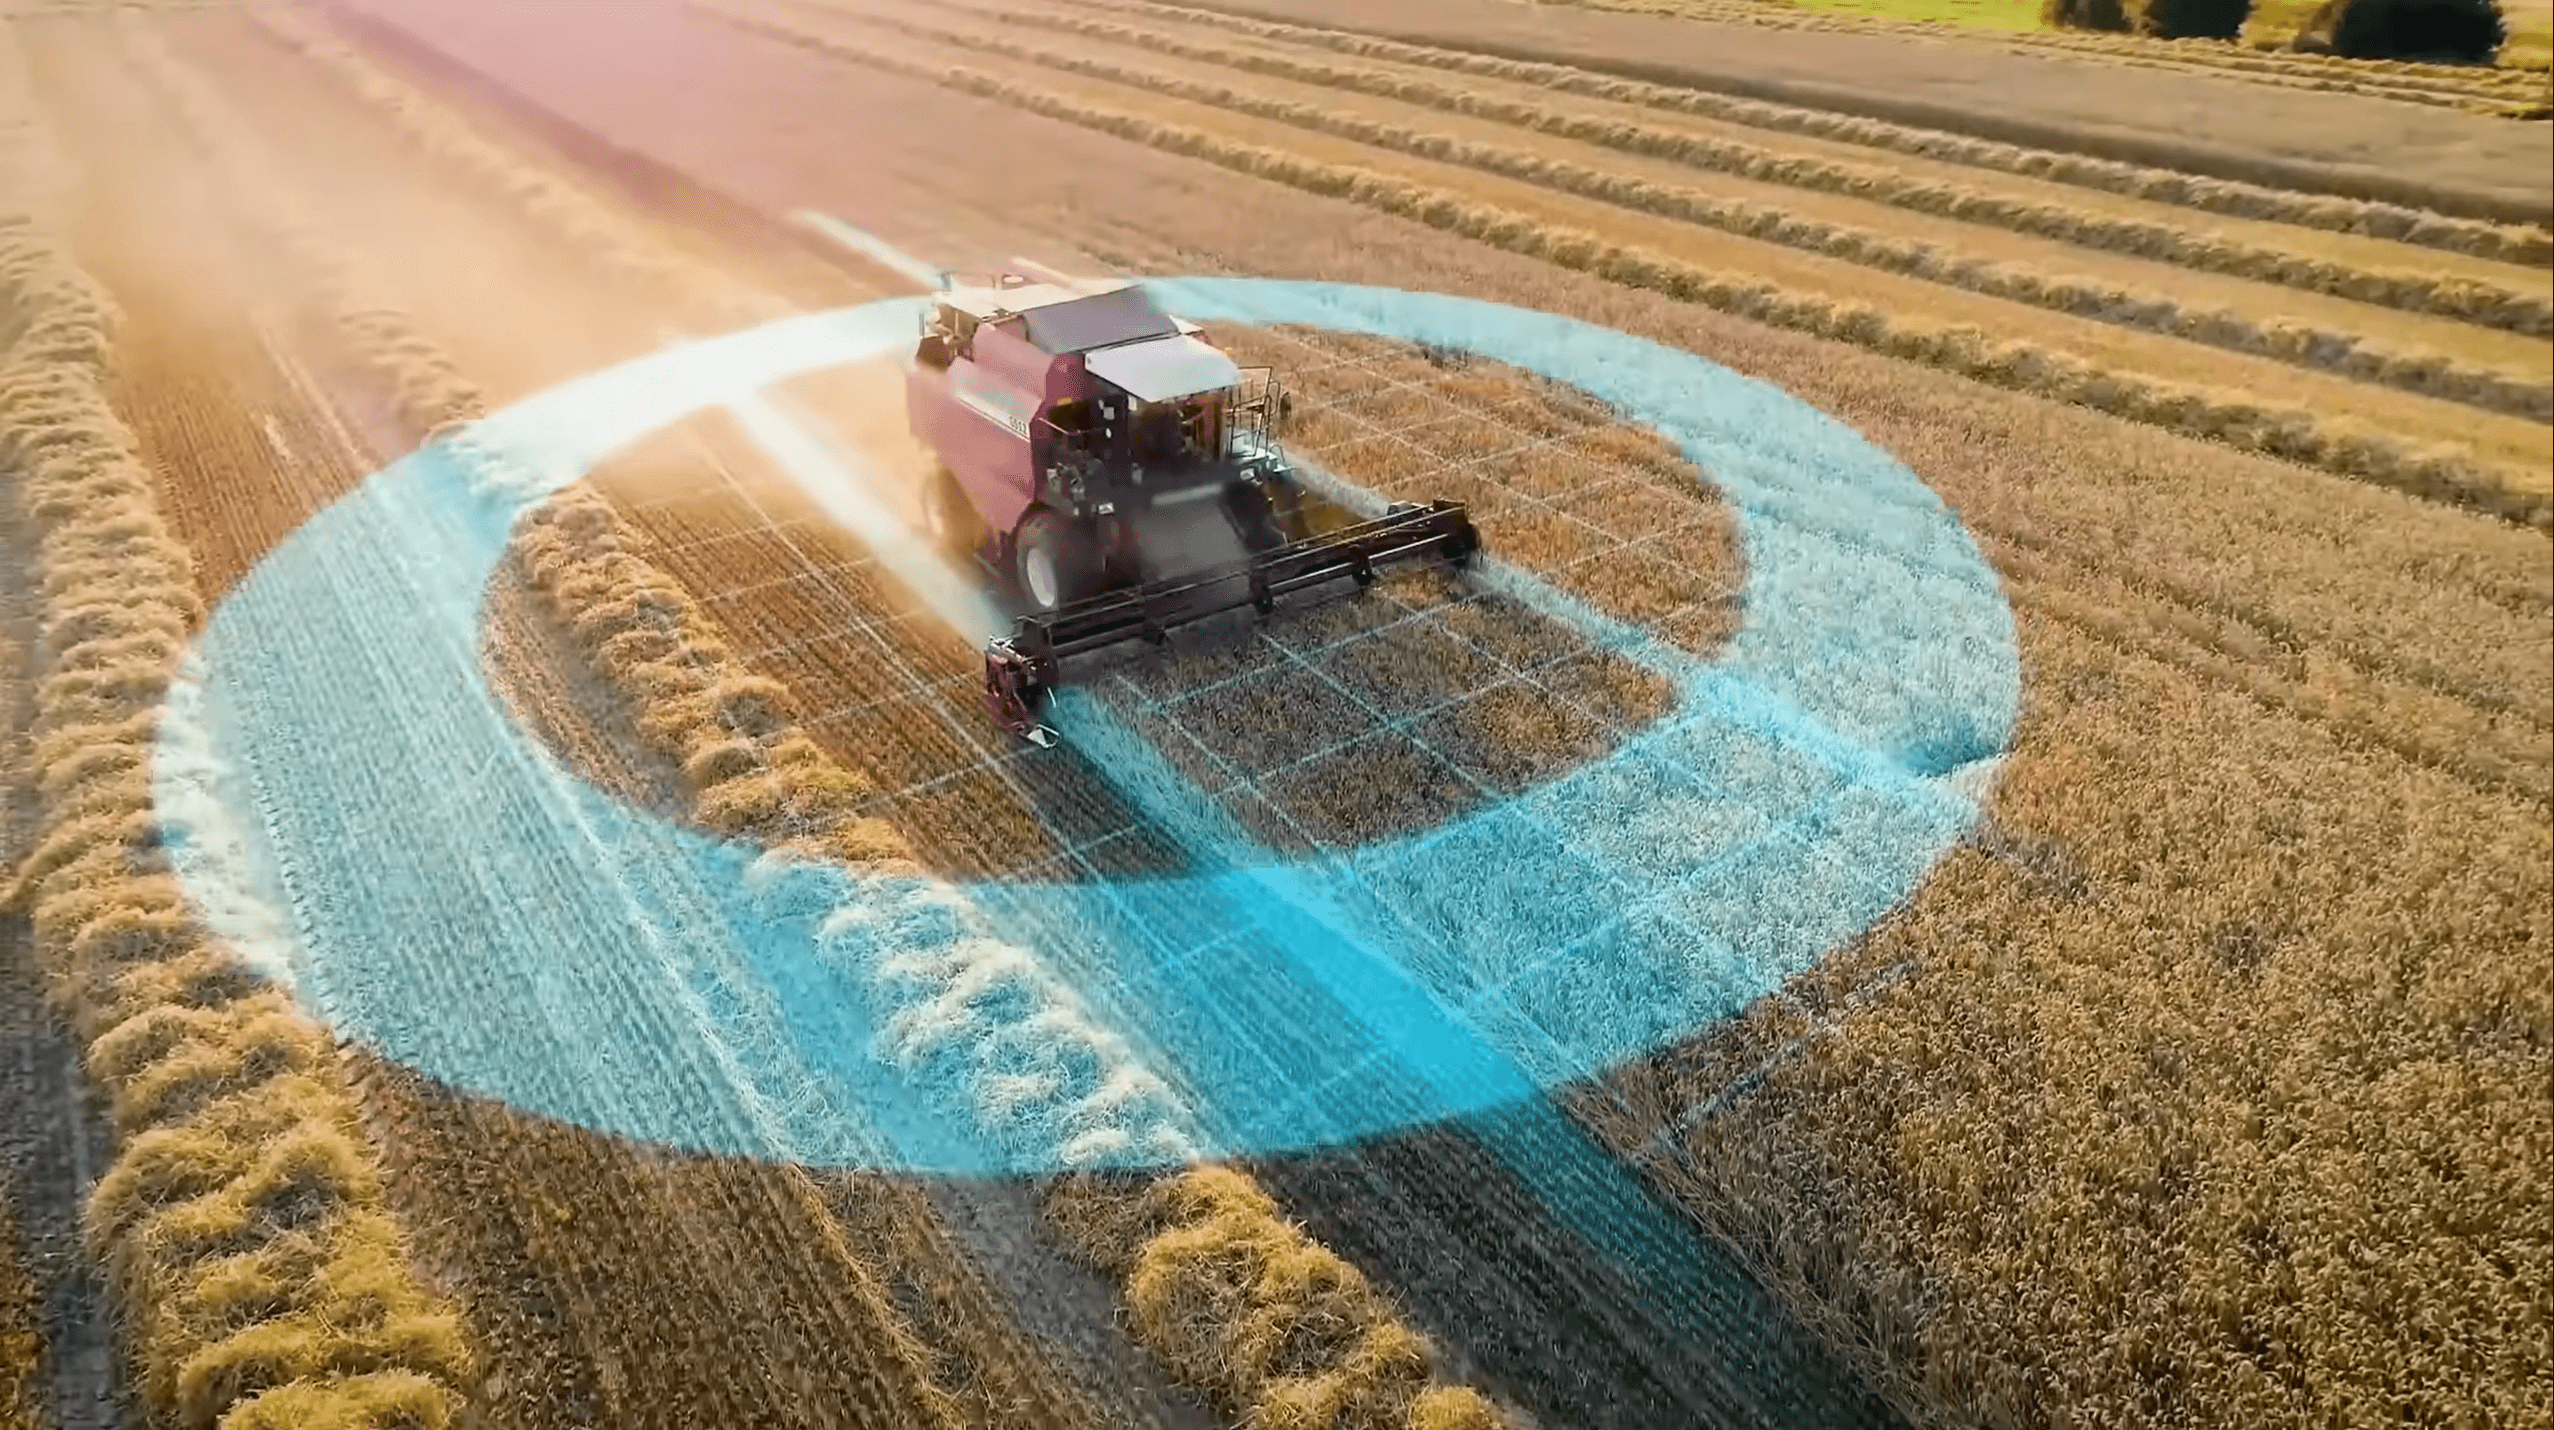
Six industry giants and 340+ challengers are competing to capture a share of $156–375 billion in annual agricultural labor costs — across two fundamentally different market systems.
INTRODUCTION
Part 1 established the why: $156–375B in annual labor costs driving 31.2–46.8M worker replacements by 2030. Part 2 identifies who delivers that transformation — and where.
Two parallel systems define the market. The $48–56B Western commercial market runs on private investment and competitive dynamics. China's $80–150B domestic ecosystem operates through state procurement and domestic manufacturers. They are complementary, not competing.
The Western market holds 346 active agricultural robotics companies. 147 have venture backing; 56 have reached Series A or beyond. Fifteen percent of participants exit or enter annually. The structure is a barbell: six giants dominate revenue share while hundreds of specialists target niches.
TIER 1: ESTABLISHED INDUSTRY GIANTS
1. John Deere — The Vertical Integrator
Deere posted $61.2B revenue in 2023 with $10.1B net income. No agricultural company spends more on R&D: $1.5B+ annually. That budget buys both technology and competitive time.
The autonomous 8R tractor reduces operator labor by 60–80%. It creates precision technician roles at $45–55/hr versus $20–25/hr for displaced operators. The workforce shifts up — it doesn't simply contract.
See & Spray Ultimate cuts herbicide use 80–90% via plant-by-plant computer vision. It processes 20+ images per second. Deere acquired Blue River Technology for $305M in 2017 specifically to build this capability.
The acquisition strategy is deliberate. Bear Flag Robotics ($250M, 2021) added autonomous navigation. GUSS Automation added orchard spraying. Smart Apply added spray control. Each purchase fills one specific gap in a closed technology stack.
Deere's real moat is not hardware. It's 1,600+ North American dealer locations and a data platform managing millions of acres. No startup replicates that distribution in a decade.
$61.2B 2023 revenue · $1.5B+ annual R&D · 1,600+ dealer locations
2. DJI — The Volume Disruptor
DJI holds 70%+ of the global commercial drone market. Its agricultural share is higher. The 1.2M agricultural drones currently operating globally are predominantly DJI hardware.
Three DJI drones, operated by one pilot, spray 150 acres per hour and replace a traditional crop-dusting plane. That unit economics drives the fastest payback in the sector: 0.3–3.0 years. No other platform class competes on speed of return.
DJI's structural position is unique. It supplies both the Western $48–56B commercial market and China's $80–150B state-directed ecosystem simultaneously. No Western competitor has equivalent dual-market reach.
The risk is regulatory. US government procurement scrutiny has slowed domestic sales. DJI continues expanding in Asia, Europe, and Latin America. Western market access remains contested, not closed.
70%+ global agricultural drone market share · 0.3–3.0 yr payback
3. AGCO Corporation — The Open Platform Bet
AGCO's $14.4B 2023 revenue spans five brands: Fendt, Massey Ferguson, Challenger, Valtra, and GSI. Each brand serves a different geography and farm scale.
Fendt's Xaver system deploys 6–8 small robots for precision seeding. The swarm approach reduces soil compaction that single heavy machines cause permanently. AGCO identified this problem before most OEM competitors did.
Fuse Technologies provides GPS guidance, automated section control, and an open integration framework. Third-party tools connect freely. That openness directly contrasts with Deere's closed proprietary ecosystem strategy.
AGCO's core bet: interoperability beats vertical integration in fragmented global markets. That argument holds strongest in Europe and developing regions where Deere's dealer density runs thin.
4. CNH Industrial — Precision Spraying at Scale
CNH's $24.7B 2023 revenue covers four brands: Case IH, New Holland, Steyr, and Miller. It competes across both developed and emerging markets simultaneously.
SenseApply launched in June 2025. It applies inputs only where cameras detect weeds, cutting herbicide use 50–60%. It deployed across all three main brands simultaneously — an operationally rare cross-brand rollout.
SenseApply competes directly with Deere's See & Spray and Ecorobotix's ARA. Precision application is the fastest-moving battleground in agricultural robotics. Three major companies are now fighting for the same segment.
5. Trimble Inc. — The Invisible Infrastructure
Trimble doesn't build tractors. It makes tractors work precisely. Its GPS/RTK positioning runs inside AGCO, CNH, and Kubota machines without carrying the Trimble brand name. Revenue reached $3.7B in 2023.
Autopilot steering, centimeter-accurate RTK correction, and Field-IQ rate control are Trimble products. Farmers often don't know this. The competitive dependency is structural regardless of brand awareness.
The business model generates recurring revenue through correction service subscriptions. Over 3,000 specialist dealers support it globally. Every autonomous tractor sold by any OEM potentially runs Trimble positioning.
6. Kubota Corporation — The Small Farm Specialist
Kubota operates across 120+ countries with dominant strength in compact equipment for farms under 10 hectares. That describes most of Asia's cultivated land.
Japan's average farmer is 68.4 years old. 71.7% of core workers are over 65. The workforce shrank 54% between 2000 and 2024. Japan needs 260,000–360,000 worker replacements by 2030. Kubota is the primary technology response.
The New Agri Concept, launched at CES 2024, is fully electric with six independent drive motors. It tills, mows, and transports through modular implements. The target: farms that cannot justify a $500K+ autonomous tractor.
Kubota's rice farming expertise is not replicable by Western OEMs. Paddy management, precision transplanting, and water control require system knowledge built over decades. Japan's 85–90% rice automation target for 2030 runs through Kubota hardware.
TIER 2: SPECIALIZED INNOVATORS
Eight companies define the innovation frontier. Each targets a gap the Tier 1 players have not closed.
Table 1 — Tier 2 Innovators: Full Comparison
| Company & Country | Funding | Technology | Key Product | Competitive Edge |
|---|---|---|---|---|
Ecorobotix · Switzerland | $150M | AI Precision Spraying | ARA sprayer | 95% chemical reduction; EU Green Deal 50% pesticide mandate by 2030 |
Carbon Robotics · USA | N/A | Laser Weeding | LaserWeeder (12 lasers) | 200K+ weeds/hr; zero chemicals; weeds cannot develop resistance |
Naïo Technologies · France | N/A | Mechanical Weeding Robots | Oz, Dino, Ted, Orio | Small-farm and vineyard specialist; vision row nav; no chemical dependency |
SwarmFarm Robotics · Aus. | $30M | Distributed Field Robotics | Modular swarm platforms | Soil compaction prevention; solar-capable; wheat, cotton, sorghum |
Burro · USA | $24M | Harvest Assist Robotics | Picker-follower robot | 15–25% productivity gain; bridges human-robot workflow without full automation |
Monarch Tractor · USA | N/A | Electric Autonomous Tractor | MK-V platform | Software-first OTA updates; subscription pricing; vineyards and specialty crops |
Saga Robotics · Norway | $11.5M | Disease Control Robotics | Thorvald (UV-C) | Farming-as-a-service; powdery mildew control; zero pesticides |
Harvest CROO · USA | N/A | Fruit Harvesting | Strawberry harvester | Commercial deployment reached; targets 15–25% berry harvest automation by 2030 |
Source: Company announcements, AgFunder, press releases 2024–2025. N/A = not publicly disclosed.
Ecorobotix leads on funding and regulatory positioning. Carbon Robotics and Harvest CROO represent the laser and mechanical harvesting frontier. Naïo Technologies fills the critical small-farm vegetable segment that large OEMs have not designed for. SwarmFarm and Burro solve field and harvest logistics problems without requiring full automation.
TOP 5 COUNTRIES: REGIONAL ANALYSIS
1. United States
The US holds 36–38% of global market revenue and 22% of all agricultural robotics companies. California hosts 50% of US firms and drives innovation. The Midwest concentrates row crop automation. The Pacific Northwest leads berry and orchard robotics.
The labor math is unambiguous. 160,000 crop worker positions remain permanently unfilled from a base of 637,000. Average annual wages run $40,602. The H-2A visa program expanded sevenfold since 2005 and still cannot close the gap.
Current deployments — 2,000–3,000 robotic milking systems, 1.2M drones, hundreds of laser weeders — have replaced 30,000–40,000 workers, eliminating $1.3–2.3B in annual labor costs. That's just 5% of the shortage. The 2026–2028 acceleration phase targets 15–25% labor replacement. Operations over 1,000 acres will reach 40–50% robotic adoption. The US market reaches $15–18B by 2030.
$15–18B projected US market by 2030 · currently 5% of shortage filled
2. China — The Parallel Ecosystem
China is not a Western commercial market competitor. It operates as a separate system at fundamentally different scale and through entirely different channels.
The government committed $200B to robotics and AI by 2025. DJI holds 70% of global agricultural drone production. China deploys 30–40% of the world's 250,000 agricultural robots. Domestic manufacturers FJDynamics and XAG supplement DJI's dominance. Mechanization covers 60% of crop production today.
By 2030, China replaces 30–45M workers and eliminates $123–310B in annual labor costs — through domestic manufacturers entirely outside the $48–56B Western-tracked market. Both ecosystems are real, growing, and running in parallel.
30–45M workers replaced by 2030 · $123–310B annual labor costs eliminated
3. Netherlands — The Productivity Benchmark
Dutch agriculture generates €93,400 gross value added per agricultural employee — Europe's highest, by a wide margin. Intensive robotics built that productivity figure over decades.
Lely installed 10,000+ robotic milking systems across Europe. Dutch greenhouse operators run 44% automation adoption. Wageningen University — the world's top-ranked agricultural sciences institution — feeds the research pipeline that spinoffs commercialize. The horticultural sector generates €100B+ in annual exports.
Dutch policy shapes EU-wide regulation. Farm to Fork standards set sustainability targets that drive investment decisions across all 27 member states. The Western market's regulatory framework largely originates in the Netherlands.
4. Germany — Engineering Depth
Western European agriculture lost 800,000 workers. German dairy operations responded by driving robotic milking to 10,000+ installed systems combined across Lely, DeLaval, and GEA. Automated dairy now delivers 50% labor reduction.
Fendt leads autonomous field robotics from Marktoberdorf. CLAAS advances combine automation. GEA leads livestock and food processing robotics. The Mittelstand ecosystem produces precision components feeding both domestic adoption and global export markets.
German average farm size is 60 hectares — between Dutch intensity and US scale. Innovation focus areas include precision viticulture, biogas integration with robotics, and reduced-tillage automation. Technology demand emphasizes modularity and retrofit over purpose-built platforms.
5. Japan — Demographic Emergency
Japan's agricultural crisis is the most acute in the developed world. Average farmer age: 68.4 years. 71.7% of workers are over 65. The workforce fell 54% from 2000 to 2024. Within a decade, most current farmers will reach physical inability to work.
By 2030, Japan needs 260,000–360,000 worker replacements representing $4.3–7.5B in annual labor costs. The robotics market reaches $4–6B. Rice automation targets 85–90% mechanization. Spread already produces 11M lettuce heads annually in automated vertical farms.
Kubota and Yanmar lead field robotics. Yamaha has operated agricultural drones since the 1980s. Panasonic, Toshiba, and Fujitsu are converting semiconductor lines to vertical farming. Japan is not struggling with automation — it is accelerating it out of existential necessity.
68.4 yrs average Japanese farmer age · 54% workforce decline since 2000
COMPETITIVE DYNAMICS
Consolidation follows a consistent logic. Incumbents buy AI and robotics capabilities rather than build them. Deere acquired Blue River, Bear Flag, GUSS, and Smart Apply across seven years. Rockwell Automation acquired Clearpath Robotics in September 2023. Startups accept acquisition because dealer networks and farmer trust take decades to build independently.
The winning competitive position combines hardware, software, AI, and data connectivity in one integrated system. Trimble's positioning runs in any OEM's tractor. DJI's SmartFarm connects to third-party analytics. CNH's SenseApply embeds ML in existing hardware. Platform plays attract disproportionate investment — they benefit from every hardware sale industry-wide.
BUSINESS MODELS: HOW FARMS ACCESS ROBOTICS
Four distinct models now coexist. Capital sales remain dominant for large operations. RaaS is expanding access to smaller farms. Shared services solve seasonal-use economics. Precision data subscriptions layer across all hardware types.
Table 3 — Agricultural Robotics: Business Model Comparison
| Business Model | Upfront Cost | Annual Cost | Farm Access | Leading Companies | Best For |
|---|---|---|---|---|---|
Capital Sale (Ownership) | $300K–500K+ | Parts + service ~20–30% of cost | Large farms only (1,000+ acres) | John Deere, AGCO, CNH, Kubota | Farms with capital access and year-round use; maximum long-term ROI if fully utilised |
Robotics-as-a-Service (RaaS) | $0 upfront | $60–80K / year | 2–3× more farms vs. ownership | Burro, Monarch Tractor, Saga Robotics | Smaller farms; capital-constrained; technology access without ownership risk |
Shared Services / Contractor | $0 upfront | Per-acre or per-season fee | Seasonal crops; small farms | AgriForce, specialist operators | Seasonal applications; farms where year-round robot ownership is hard to justify |
Precision Subscription (SW/Data) | $2–5K hardware | $2–8K / year software license | Any farm size; global reach | Trimble, CNH Connected, Deere Ops Center | Adding digital intelligence to existing machinery; complements all three hardware models |
Source: Company announcements; Part 1 economics analysis; Mordor Intelligence (2025).
RaaS is the most important structural shift. Converting $300K+ purchases into $60–80K annual subscriptions reaches 2–3x more farms. The global RaaS market exceeds $3B in 2025. Contractors deploying robots across multiple farms extend the model further into seasonal crop applications.
INVESTMENT LANDSCAPE
Recent major rounds: Ecorobotix $150M, SwarmFarm $30M, 4AG Robotics $29M, Burro $24M, Agtonomy $18M, Bonsai Robotics $15M, Saga Robotics $11.5M, TRIC Robotics $5.5M. Capital concentrates in commercial-ready products with near-term deployment paths.
Specialist investors include Agfunder, S2G Ventures, Cultivator, and OurCrowd. Corporate venture arms from CNH Industrial and Trimble Ventures are active. The US leads venture funding. Europe relies on EU grants and framework programs. China operates through $200B state commitment to domestic manufacturers and Belt and Road export corridors.
CONCLUSION
Ten companies and six countries will determine how fast $156–375B in annual labor costs actually get eliminated. The economics are clear — the variable is deployment speed.
Deere dominates Western commercial deployment but faces open-platform competition. DJI controls global drone volume but faces Western regulatory pressure. China's state-directed ecosystem replaces workers at 20x the Western rate by volume. Japan's companies solve the small-farm problem that US manufacturers have not designed for.
Current 10–23% market penetration reflects real constraints: capital requirements, regulatory barriers, technical limits in specialty crops. Proven economics push through those constraints steadily. Deployment-weighted payback runs 1.7–1.8 years. Capital-weighted payback runs 2.3–2.8 years. Farmers who run the numbers adopt.
The $48–56B Western market and China's $80–150B ecosystem represent $156–375B in annual labor costs waiting to be eliminated. The companies in this article are doing the eliminating.
Continue to Part 3: Weeding & Crop Management — covering the $3–10B annual segment where laser and mechanical systems are achieving 90%+ herbicide reduction.
REFERENCES
Market Research & Industry Analysis
Grand View Research. (2024). Agricultural Robots Market Size, Share & Trends Analysis Report. grandviewresearch.com
Mordor Intelligence. (2025). Agricultural Robots Market – Growth, Trends, and Forecasts (2025–2030). mordorintelligence.com
MarketsandMarkets. (2025). Agricultural Robot Market by Type, Application, and Geography – Global Forecast to 2030. marketsandmarkets.com
Fortune Business Insights. (2025). Agricultural Robots Market Size, Share & Industry Analysis 2032. fortunebusinessinsights.com
360 Research Reports. (2024). Global Agricultural Robots Market Research Report. 360researchreports.com
Agfunder. (2025). AgriFood Tech Investment Report 2024. agfunder.com
IDTechEx. (2024). Agricultural Robots, Drones, and AI: 2024–2034. idtechex.com
Company Reports & Corporate Filings
Deere & Company. (2024). 2023 Annual Report. Moline, IL. deere.com/investor
AGCO Corporation. (2024). 2023 Annual Report. Duluth, GA. agcocorp.com
CNH Industrial N.V. (2024). 2023 Annual Report. Amsterdam. cnhindustrial.com
Trimble Inc. (2024). 2023 Annual Report. Westminster, CO. trimble.com
Government & Institutional Sources
USDA NASS. (2025). Farm Labor. nass.usda.gov
Eurostat. (2024). Agriculture Statistics – Farm Structure. ec.europa.eu/eurostat
Japan MAFF. (2024). Agricultural Census and Workforce Statistics. maff.go.jp
Agricultural Robotics Research Series:
Part 1: Labour Crisis — How Robots Will Fill the Global Agricultural Workforce Gap
Part 2: Agricultural Robotics | Market Leaders, Regional Analysis & Top Countries
Part 3: Agricultural Robotics | $34B Weeding Robot Market
Part 4: Agricultural Robotics | Harvesting Robots: $6.9B Market
Part 5: Agricultural Robotics | Precision Planting & Seeding
Part 6: Agricultural Robotics: Crop Monitoring and Aerial Scouting
Part 7: Dairy & Livestock Automation
Part 8: Autonomous Tractors & Field Machines
Part 9: Post-Harvest Automation — Sorting, Grading & Cold Chain
Part 10: Future Trends 2025–2030








Leave a comment