


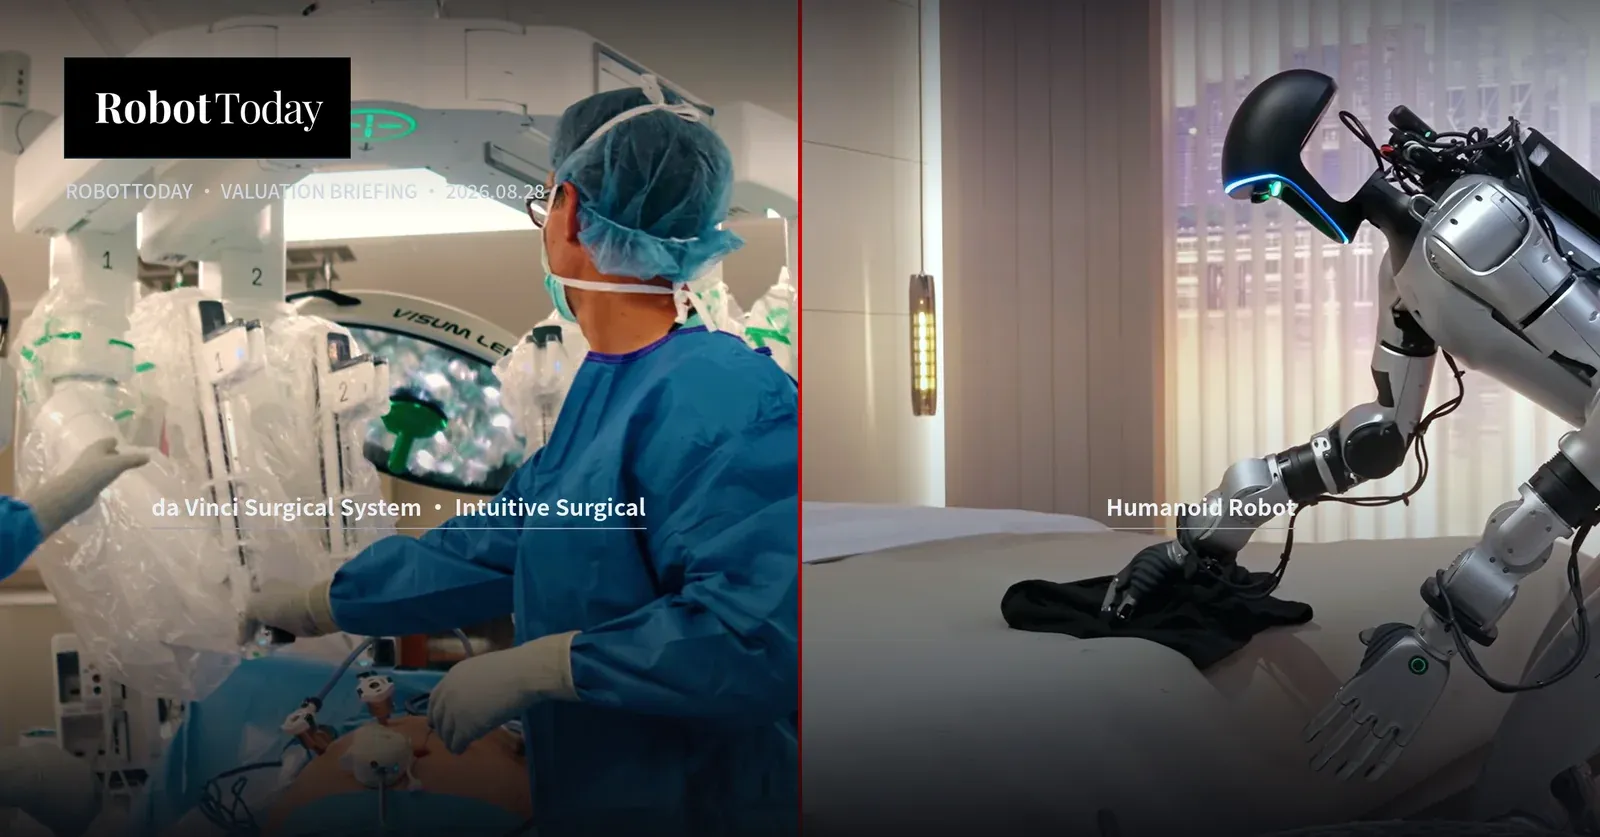
Objective briefing for research and editorial reference only. Not investment advice. Data as of August 27, 2026; quotes as of the August 26 close.
Executive Summary
Comparing Intuitive Surgical (ISRG) with Unitree (STAR Market 688836) calls for one clarification first: the two differ substantially in financial structure, customer base, revenue form and valuation level, and a direct comparison can mislead. This briefing aligns definitions before comparing, and sets out every constructed measure, with its arithmetic, in Appendix A.
At ISRG, instruments and accessories plus services made up 76.4% of second-quarter 2026 revenue, and an installed base of 11,710 da Vinci systems forms an ongoing revenue base; the stock trades at 42.5 times earnings. Unitree's revenue currently comes mainly from unit sales, and its prospectus does not present a consumables or service line tied to the installed base; on the rolling measure constructed here, it trades at roughly 410 times.
The comparison is therefore less about which company is better than about where the uncertainty sits: one is an established business already generating cash but facing changing growth and competition; the other is early in commercialization, with a valuation that reflects expectations well beyond current results.
1. The Two Sets of Numbers
The table compares the two as of August 27, 2026. ISRG's revenue and earnings are the company's own trailing-twelve-month figures; Unitree has not yet filed a half-year report, so its rolling figures are constructed here, as set out in Appendix A1. The two are not strictly comparable, and each is labeled accordingly.
Metric | Intuitive Surgical (ISRG) | Unitree (688836) |
|---|---|---|
Ticker and listing venue | NASDAQ: ISRG | Shanghai STAR Market 688836 |
Voting structure | Single class of common stock | Dual class: A shares ten votes, B shares one; 44,074,296 A shares held by founder Wang Xingxing |
Listing date | June 2000 | August 19, 2026 |
Market cap (Aug 26) | US$130.1B | RMB239.25B ≈ US$33.5B |
Shares and free float at listing | ~353M shares, fully floating | 404.46M shares; 7.44% freely traded at listing |
Rolling twelve-month revenue | US$11.03B (as reported) | RMB2.075B ≈ US$291M (constructed, see A1) |
Rolling twelve-month net income | US$3.14B (as reported) | RMB584M ≈ US$82M (constructed) |
P/E on the above | 42.5x | ~410x |
P/S on the above | 11.9x | ~115x |
Gross margin | 66.7% (Q2 2026, GAAP) | 60.13% (FY2025 core business, audited) |
Latest revenue growth | +19% (Q2 2026) | +48.54% (H1 2026) |
Latest earnings | Consistently profitable | Adjusted net profit RMB244M, −19.34% YoY |
Consumables and service share | 76.4% (Q2 2026, computed here, see A2) | No comparable line item disclosed |
Installed base | 11,710 da Vinci and 1,096 Ion systems | 5,511 humanoids shipped, 5,215 sold in FY2025 |
Customer mix | Hospitals; procedures largely reimbursed | 73.60% research and education, Jan-Sep 2025 (see A4) |
Recent price action | From US$207.1B at end-2025 to US$130.1B | From an RMB1,100 open to about RMB591.5 (−46%) |
FX at RMB7.14 per US dollar. ISRG figures from its Q2 2026 results and stockanalysis.com; Unitree figures from the audited prospectus, listing announcement and offering documents.
For a sense of scale: ISRG's market cap alone roughly equals the combined value of the 15 Chinese robotics listings selected here plus one more Inovance, and its annual net income roughly equals FANUC, Teradyne, Inovance and Yaskawa combined. The constituent list is the author's selection; Chinese figures are mostly on an FY2025 annual-report basis while Japanese and US figures are trailing twelve months. See Appendix A6.
2. Where the Business Models Diverge
Instruments and accessories plus services made up 76.4% of ISRG's second-quarter 2026 revenue. Instruments carry usage limits and are replaced as procedures occur; service revenue comes from post-installation contracts. On a rough construction that annualizes one quarter over the period-end fleet, each system corresponds to about US$690,000 of annual consumables and service revenue, as set out in Appendix A3. This structure lets the revenue base build with the installed fleet, and is one way to read a 42.5 times multiple on 19% growth.
Unitree recognizes revenue when a unit is delivered. Its prospectus does not present a consumables or service line tied to the installed base, so this briefing does not count one. That is not the same as saying no aftermarket or parts revenue exists, only that current disclosure does not identify it separately. Cost performance is clearly documented: quadruped unit cost fell from RMB22,300 in 2022 to RMB12,100 in January to September 2025, with humanoid gross margin at 62.91% in the same period. On pricing, the G1 starts at RMB85,000 and the R1 Air is listed at RMB29,900.
A third difference lies in where customer funding comes from. A hospital buying a da Vinci can calculate volumes, reimbursement and payback. Of Unitree's humanoid revenue from January to September 2025, research and education customers accounted for 73.60%, consumer for 17.39% and industry applications for 9.01%; within industry applications, RMB15.702M, or 29.29% of that line, is attributable to defined industrial settings. Denominators and periods appear in Appendix A4. The mix indicates that current demand is funded largely by research budgets, a growth path that differs from equipment bought on a return calculation.
3. R&D Spending: A Comparison Easily Misread
R&D spending is often used to assess Unitree's claim of full-stack in-house development. Comparing absolute R&D mainly reflects the difference in scale: ISRG spent US$1,311.8M in FY2025, about RMB9.37B, roughly 5.5 times Unitree's revenue that year. A more comparable view is R&D intensity at similar revenue levels, and how intensity has moved at each company.
R&D measure | Intuitive Surgical (ISRG) | Unitree |
|---|---|---|
R&D intensity at US$0.2-0.4B revenue | 7.7% (2005) / 8.0% (2006) | 8.53% (FY2025) / 11.80% (H1 2026) |
Latest full-year intensity | 13.03% (US$1,311.8M / US$10,064.7M) | 8.53% (RMB145M / RMB1,699M) |
Earlier years | 8.2% (2010) / 8.3% (2015) | 24.4% (2022) / 31.4% (2023) / 17.8% (2024) |
When intensity stepped up | From about 8% to about 14% after 2018 | H1 2026 up RMB82.04M (+152%); 6.94% to 11.80% |
Latest absolute R&D | US$1,311.8M (FY2025) | RMB135.9M ≈ US$19M (H1 2026) |
Main focus of the spending | Clinical trials, approvals, platform iteration | Hardware and structure, embodied AI, cost reduction |
ISRG figures from its Q4 2025 release filed with the SEC, its FY2006 results announcement and Macrotrends historical series; Unitree figures from the audited prospectus and listing announcement.
First, at comparable revenue levels the two intensities are not far apart. ISRG ran 7.7% at US$227M of revenue in 2005 and 8.0% at US$373M in 2006. Unitree ran 8.53% in FY2025 and 11.80% in the first half of 2026. The common statement that Unitree spends under a third of the industry average draws on an average that includes loss-making peers with small revenue bases, where intensity is elevated by a small denominator; applying it to a profitable company warrants that caveat.
Second, both companies have seen intensity step up alongside changes in their environment. ISRG held near 8% for years before moving to roughly 14% after 2018, the period when Medtronic and Johnson & Johnson entered surgical robotics. Unitree's R&D rose by RMB82.04M year over year in the first half of 2026, with intensity moving from 6.94% to 11.80%; the company attributed the decline in adjusted profit to a relatively large year-on-year increase in period expenses including R&D and selling expenses. The two series move together; this briefing does not assign a direction of causation.
Third, the composition differs. ISRG's R&D includes clinical trials and multi-country regulatory registration, spending that connects to its approvals and to subsequent instrument and service revenue. Unitree's goes mainly to robot hardware and structure, embodied-AI models and cost reduction. The difference does not show up in the amounts, but it bears on what kind of asset the spending becomes.
For scale: the RMB3.578B, about US$501M, of Unitree's funded-project budget earmarked for R&D-type projects, split across RMB2.022B for embodied-AI models, RMB1.110B for robot hardware and RMB445M for new products and spent over several years, is roughly equivalent to 4.6 months of ISRG's FY2025 R&D.
4. What Each Case Requires to Hold
The case for ISRG:
Earnings already exist and the valuation does not depend on assumptions about future technology; consumables and services at 76.4% of revenue give the mix relative stability.
The installed base is still growing, with da Vinci up 12% and Ion up 21%, and procedure volume up about 16% in the second quarter of 2026.
Switching costs arising from regulatory clearance, clinical evidence and surgeon training are high.
The case for Unitree:
The company reports 5,511 humanoid units shipped in FY2025, which it describes in its prospectus as the highest shipment volume globally, and two consecutive profitable years. This briefing has not independently verified that ranking.
Revenue growth is materially higher than ISRG's, at 48.54% in the first half of 2026 against 19% in ISRG's second quarter, in a market whose eventual size is undetermined.
RMB2.022B of the funded-project budget goes to embodied-AI model development, addressing a capability gap the company itself acknowledges.
5. Risks on Both Sides
For ISRG, the current debate is increasingly centered on valuation and the sustainability of growth. Market cap has fallen from US$207.1B at the end of 2025 to US$130.1B, about 37%; over the same period the company reported procedure growth of roughly 16%, below earlier rates. Medtronic's Hugo, Johnson & Johnson's Ottava and China's MicroPort MedBot are entering the market, a variable for long-term share.
For Unitree, the main variables are timing and structure. Founder Wang Xingxing told the World Robot Conference that large-scale deployment into factories and homes remains two to five years away or longer. Adjusted net margin was 21.2% in the first half of 2026, down from 34.8% in FY2025, and only 7.44% of shares were freely traded at listing. The offer price implied a P/E of 219.23 times before non-recurring items on a post-offering share count, or 103.25 times after them, against a 38.56 times one-month average static P/E for the industry.
The performance implied by valuation can be shown by static arithmetic. The first-day opening price of RMB1,100 corresponds to a market cap of RMB444.9B, an opening print rather than a close. Assuming a steady-state net margin of 20%, in line with the 21.2% adjusted margin in the first half of 2026:
Target P/E | Required net profit | Required revenue | vs constructed TTM |
|---|---|---|---|
150x | RMB2.97B | RMB14.8B | 7.1x |
100x | RMB4.45B | RMB22.2B | 10.7x |
60x | RMB7.42B | RMB37.1B | 17.9x |
40x | RMB11.12B | RMB55.6B | 26.8x |
Method: required net profit equals RMB444.9B divided by the target P/E; required revenue equals that divided by 20%. Constructed TTM revenue is RMB2.075B. For reference, the company disclosed in review responses that its funded manufacturing base, designed for 75,000 humanoids and 115,000 quadrupeds a year, targets RMB5.7B of annual revenue once fully ramped in year five. This is static arithmetic, not a forecast; see Appendix A5.
6. Metrics Worth Tracking
For ISRG:
Quarterly procedure growth, about 16% in the second quarter of 2026, and da Vinci 5 as a share of placements, 246 of 468 in that quarter.
The consumables-and-service share of revenue, and the direction of the per-system annualized figure.
Competitor clinical progress and placements, particularly outside the United States.
For Unitree:
The direction of industry applications as a share of humanoid revenue, 9.01% from January to September 2025, and the absolute size of the industrial portion within it.
Adjusted net margin and R&D intensity, 21.2% and 11.80% respectively in the first half of 2026.
Whether the first formal half-year and annual reports confirm or adjust the reviewed figures in the listing announcement.
Construction progress at the funded manufacturing base, with production from year three and full ramp by year five, and the lock-up schedule of six months for 10% of the placement tranche and 12, 24 and 36 months for strategic and pre-IPO holders.
7. Conclusion
If the question is narrowed to which is the better robotics company, the answer depends on the yardstick: on realized earnings and the stability of the revenue mix, ISRG leads clearly; on growth and the potential size of its category, Unitree's range of outcomes is wider.
More precisely: ISRG's valuation corresponds mainly to revenue and profit already generated, Unitree's mainly to commercialization that has not yet occurred. The first calls for tracking growth and competition; the second, the pace at which its application mix shifts. Because the sources of uncertainty differ, comparing them on a single multiple invites a misleading conclusion.
One historical reference: ISRG's revenue was US$227.3M in 2005, with a year-end market cap of US$4.24B. Unitree's constructed rolling revenue is about US$291M, against a US$33.5B market cap on August 26. ISRG took roughly twenty years to move from that revenue scale to US$10B. The two operate in different industries, regulatory settings and capital markets; this is offered as a scale reference, not a path forecast.
Appendix A. Definitions and Constructed Measures
Item | Definition |
|---|---|
A1 Constructed rolling twelve months | Unitree has not yet filed a 2026 half-year report; H1 2026 figures come from post-period disclosure in its STAR Market listing announcement (August 17-18, 2026) and are reviewed rather than audited. The rolling measure used here is FY2025 audited minus H1 2025 plus H1 2026. Revenue: 16.99 − 7.7572 + 11.5225 = RMB2.075B. Net income: 2.7821 − (−0.3202) + 2.74 = RMB584M. Adjusted net income: 5.9075 − 3.02 (derived) + 2.44 ≈ RMB533M, where H1 2025 is back-calculated from the −19.34% change and not directly disclosed. The measure mixes audited and reviewed figures, is not a company-reported number, and is not strictly comparable with ISRG's reported TTM. |
A2 Definition of the 76.4% share | Computed here from the three revenue lines in ISRG's Q2 2026 report: instruments and accessories of US$1,735M plus services of US$472M equals US$2,207M, divided by total quarterly revenue of US$2,890M, or 76.4%. The company does not disclose a metric labeled "recurring revenue"; the word describes the character of these lines, not company terminology. Instruments and accessories vary with procedure volume and services come from post-installation contracts; neither is a one-time system sale, but neither is contracted subscription revenue either. |
A3 The US$690k per system figure | Equals (US$1,735M + US$472M) × 4 ÷ (11,710 + 1,096) = US$8,828M ÷ 12,806 systems ≈ US$689,000. It annualizes a single quarter over the period-end installed base and does not adjust for growth within the period, model mix or geography. The company does not disclose this metric. |
A4 Denominators behind 73.60% and 9.01% | All three come from the prospectus filed March 20, 2026, cover January to September 2025, and are shares of humanoid-robot revenue for that period (RMB595.19M), not of total company revenue and not of full-year 2025. The split is 73.60% research and education, 17.39% consumer and 17.39%... corrected: 17.39% consumer and 9.01% industry applications. The RMB15.702M figure is the portion within humanoid industry-application revenue attributable to defined industrial settings such as smart manufacturing and inspection, or 29.29% of that line, not company-wide industrial revenue. Whether a restated full-year 2025 basis exists could not be verified. |
A5 The revenue-requirement arithmetic | Required net profit equals target market cap divided by target P/E; required revenue equals required net profit divided by an assumed net margin. The target is RMB444.9B, the market cap implied by the RMB1,100 first-day opening price, which was an opening print rather than a close. The assumed 20% net margin references the 21.2% adjusted margin in H1 2026 (2.44 ÷ 11.52). The calculation is static: it excludes changes in share count, income on over-raised proceeds, tax effects and discounting, and is not a forecast. |
A6 FX and aggregation | Converted at RMB7.14 and HKD7.8 per US dollar. The two aggregations mentioned in the text — that ISRG's market cap roughly equals 15 selected Chinese robotics listings plus one more Inovance, and that its net income roughly equals FANUC, Teradyne, Inovance and Yaskawa combined — use a constituent list chosen by the author, not any index or industry classification. Chinese figures are mostly FY2025 annual-report basis while Japanese and US figures are trailing twelve months, so the periods do not fully align. |
A7 IPO proceeds and capacity | The RMB4.202B figure is the amount the prospectus allocates to funded projects, not the amount actually raised. At RMB150.80 per share on 40,446,434 shares, gross proceeds were RMB6.099B and net proceeds RMB5.917B, an over-raise whose use was not verified here. The prospectus states that 85.15% of proceeds go to R&D-type projects, the first three totaling RMB3.578B. Annual capacity of 75,000 humanoids and 115,000 quadrupeds is the design capacity of the fourth project, an intelligent-robot manufacturing base costing RMB624M; review responses indicate production from year three and full ramp by year five, with a stated annual revenue target of RMB5.7B once ramped. |
Sources
Unitree: prospectus filed March 20, 2026 and approved version of May 25, 2026; STAR Market listing announcement of August 17-18, 2026; risk notice of August 7; offering and pricing announcements of July 31 and August 14; and review responses. Quotes from Sina Finance and East Money. ISRG: Q2 2026 and Q4 2025 earnings releases filed with the SEC, FY2006 results announcement, stockanalysis.com, companiesmarketcap and Macrotrends historical series.
Disclaimer: This is a factual briefing prepared for editorial and research purposes. It is not a recommendation to buy, sell or hold any security, and does not constitute investment, legal or tax advice. Measures labeled as constructed, derived or author-selected are not company-disclosed figures. Market data is time-sensitive; readers should verify independently and form their own judgment.






Leave a comment