


1. Executive summary
The World Robot Conference is the largest robotics trade event in China, and its exhibitor list is a usable read on what the domestic industry is currently building. This report classifies 248 of the 316 directory entries against the RobotToday taxonomy and describes the distribution that results.
A hardware show. 139 exhibitors (56.0%) build robots and 137 (55.2%) supply components. Software and platforms account for 37 (14.9%).
Two categories carry the floor. Motion & Actuation (75 exhibitors) and Humanoid (72) sit well ahead of third place. Perception & Vision (48), Legged Robot (37) and Commercial Service Robot (28) follow. Four of those five sit on one supply chain: platforms and the actuation and sensing they need.
The humanoid chain narrows upstream. 89 exhibitors build humanoid or legged platforms. Behind them sit 75 suppliers of joints and actuation, 48 in perception and 24 in end-effectors. Compute falls to 12 exhibitors and power to 5.
Platform builders buy rather than make. 68 of the 89 platform companies (76%) declare no component category of their own. 21 integrate at least one in house.
Manufacturing is the main destination. 165 exhibitors sell into manufacturing. Healthcare & Senior Care is second at 56. Consumer, defence, agriculture and construction remain small.
Section 2 covers how the sample was built and how the figures should be read. Sections 3 and 4 present the structural distribution and the humanoid chain.
2. Scope and method
2.1 How the sample was built
The published WRC 2026 exhibitor directory lists 316 entries. Each was checked against the RobotToday supplier index. Entries already in the index keep the classification held in the library; the remaining entries were researched individually against company websites. 68 entries sit outside the analysis, in most cases because the evidence needed to classify them was not available.
Segment | Count | Treatment |
|---|---|---|
Already in the RobotToday index | 119 | Classification pulled from the library by directory slug |
Group entry already in the index | 15 | Chinese subsidiary of a listed group; classification from the parent record |
Newly researched for this report | 114 | Website verified company by company, then classified |
Included in analysis | 248 | The sample used throughout this report |
Website could not be verified | 31 | Excluded: classification evidence came from the show directory, not the company |
No substantive robotics business | 16 | Excluded after checking the official website |
Not a company | 18 | Associations, innovation centres, university teams, pavilion names |
Duplicate entry | 3 | Same exhibitor listed twice (two of them holding two booths each) |
Table 1. Composition of the 316 directory entries and the treatment applied to each segment.
2.2 Counting conventions
Category, role and application are multi-valued, so one company can appear under several values of the same facet. The average exhibitor carries 1.9 categories. Bar lengths therefore sum to more than 248, and every percentage in this report is calculated as companies in that value divided by 248. Layer coverage is de-duplicated per company: a firm that builds robots and also sells components counts once in each of the two layers.
3. Industry structure
3.1 Where the exhibitors sit
Robot systems and core components are close together: 139 exhibitors against 137, or 56.0% and 55.2% of the sample. Software and platforms reach 37 exhibitors (14.9%). The layers overlap, so these shares do not divide the sample between them. What the figures show is the distance between the first two layers and the third.
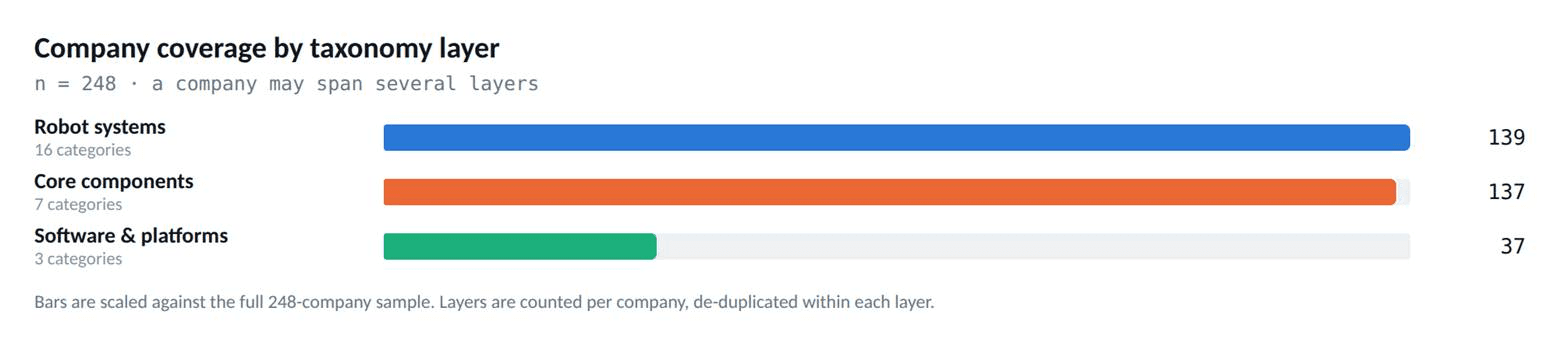
Figure 1. Company coverage by taxonomy layer, counted per company and de-duplicated within each layer.
Software appears at this show mostly as a component of a hardware product rather than as a product line in its own right. 9 exhibitors carry Cloud & Data as a category.
3.2 Category distribution
Motion & Actuation is the largest single category at 75 exhibitors, with Humanoid at 72. Third place, Perception & Vision, stands at 48. The largest categories are the humanoid and legged platforms themselves plus the actuation and sensing those platforms need; end-effectors, at 24, sit further down than the attention paid to dexterous hands would suggest.
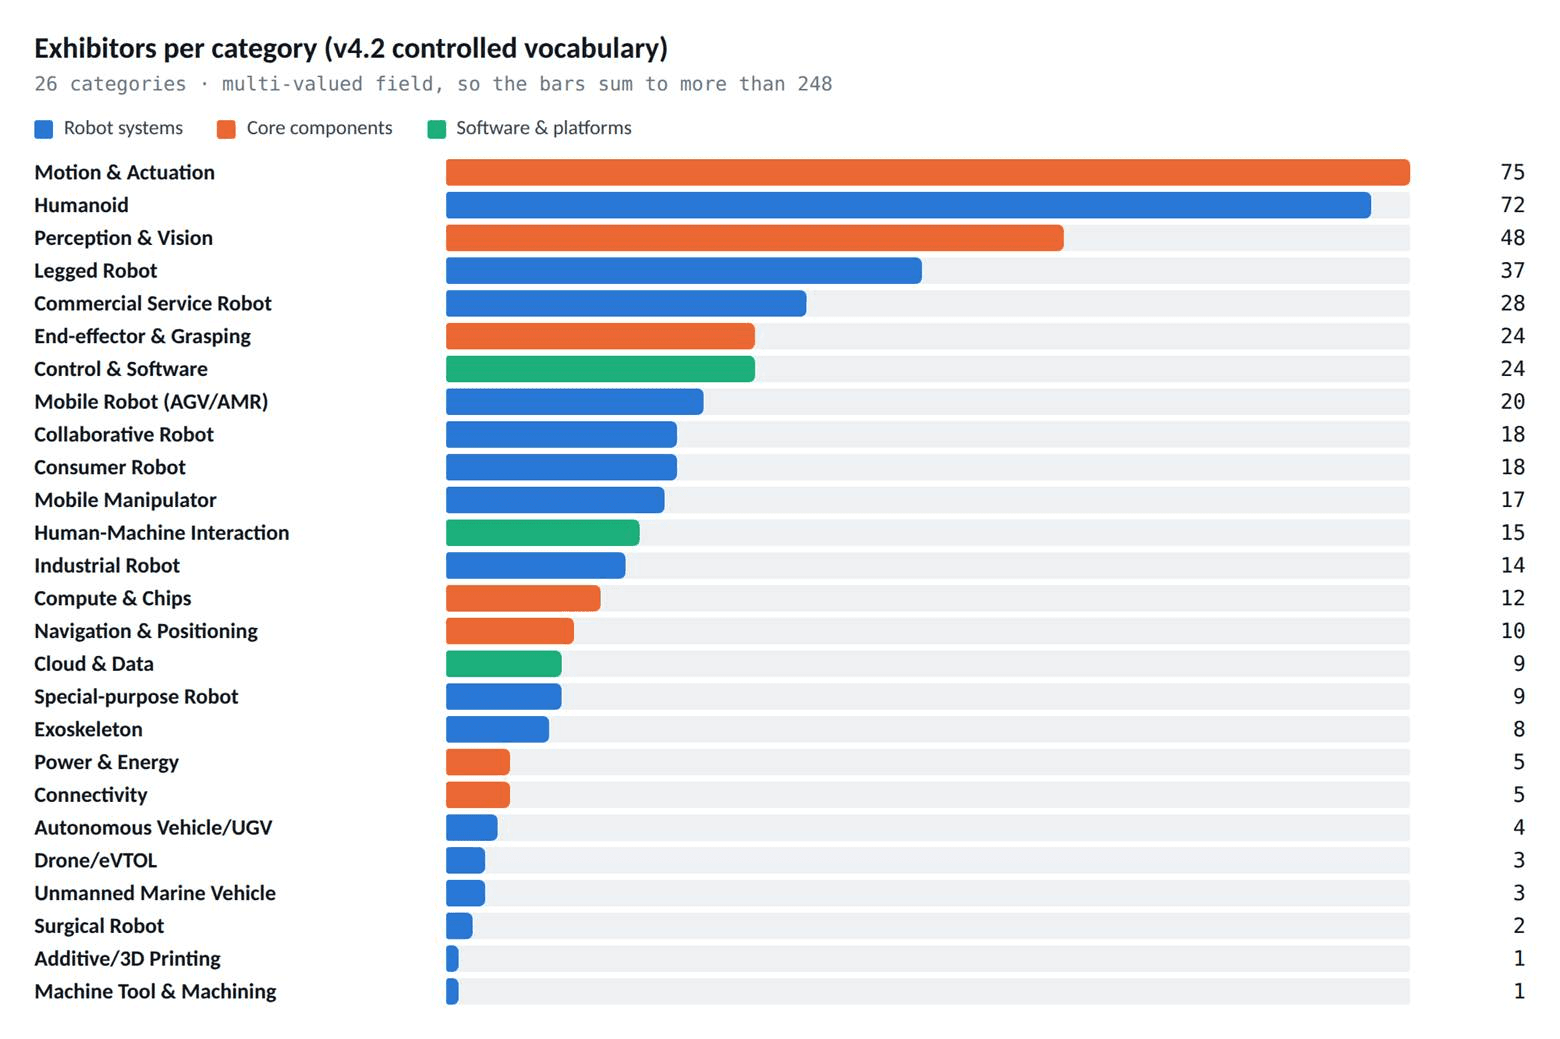
Figure 2. Exhibitors per category, coloured by layer. Multi-valued field: the bars sum to more than 248.
At the other end of the distribution, several categories that matter in the global market are close to absent: Additive/3D Printing (1), Surgical Robot (2), Drone/eVTOL (3) and Unmanned Marine Vehicle (3). Medical robotics has separate trade events in China, which accounts for part of the gap. Power & Energy (5) and Connectivity (5) are also thin against 89 platform builders, which is harder to attribute to show composition.
3.3 Roles and target industries
On the supply side, 161 exhibitors present as manufacturers and 128 as component suppliers, with 36 in software and algorithms. System integrators number 7 and robots-as-a-service providers 4. The floor is weighted towards companies that build products rather than deploy them.
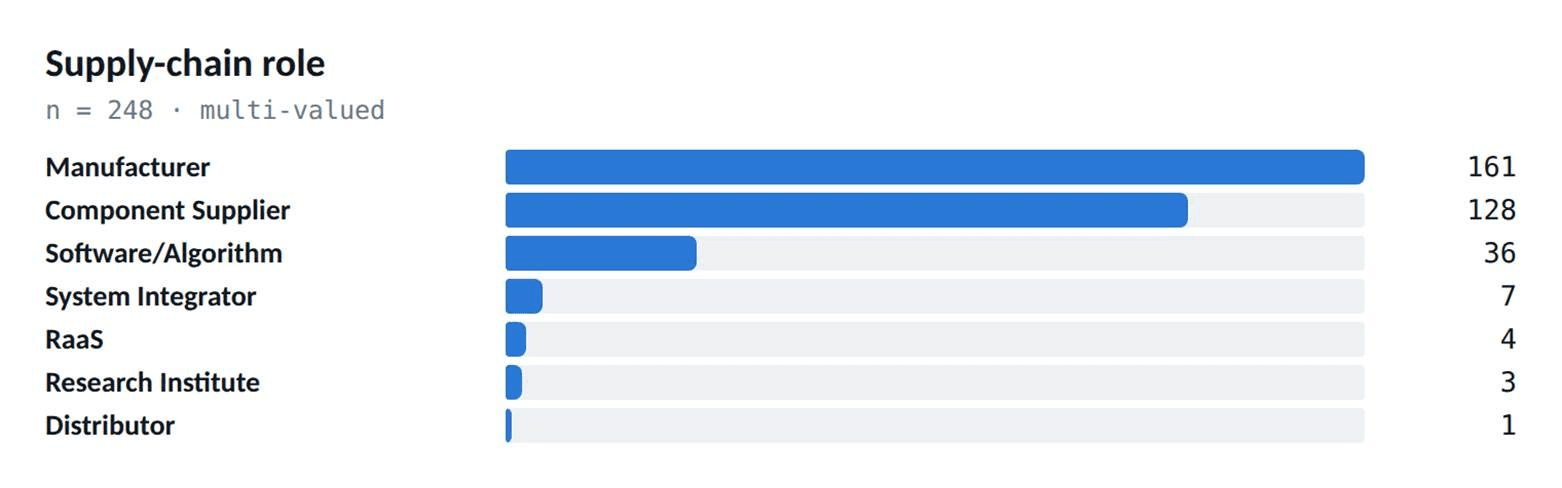
Figure 3. Supply-chain role. Multi-valued: most manufacturers also declare a component role.
On the demand side, manufacturing takes 165 exhibitors. Healthcare and senior care (56), logistics (54) and education and research (53) form a second group of comparable size. Education and research ranking this high is characteristic of an early market, where research platforms and teaching kits carry the first revenue.
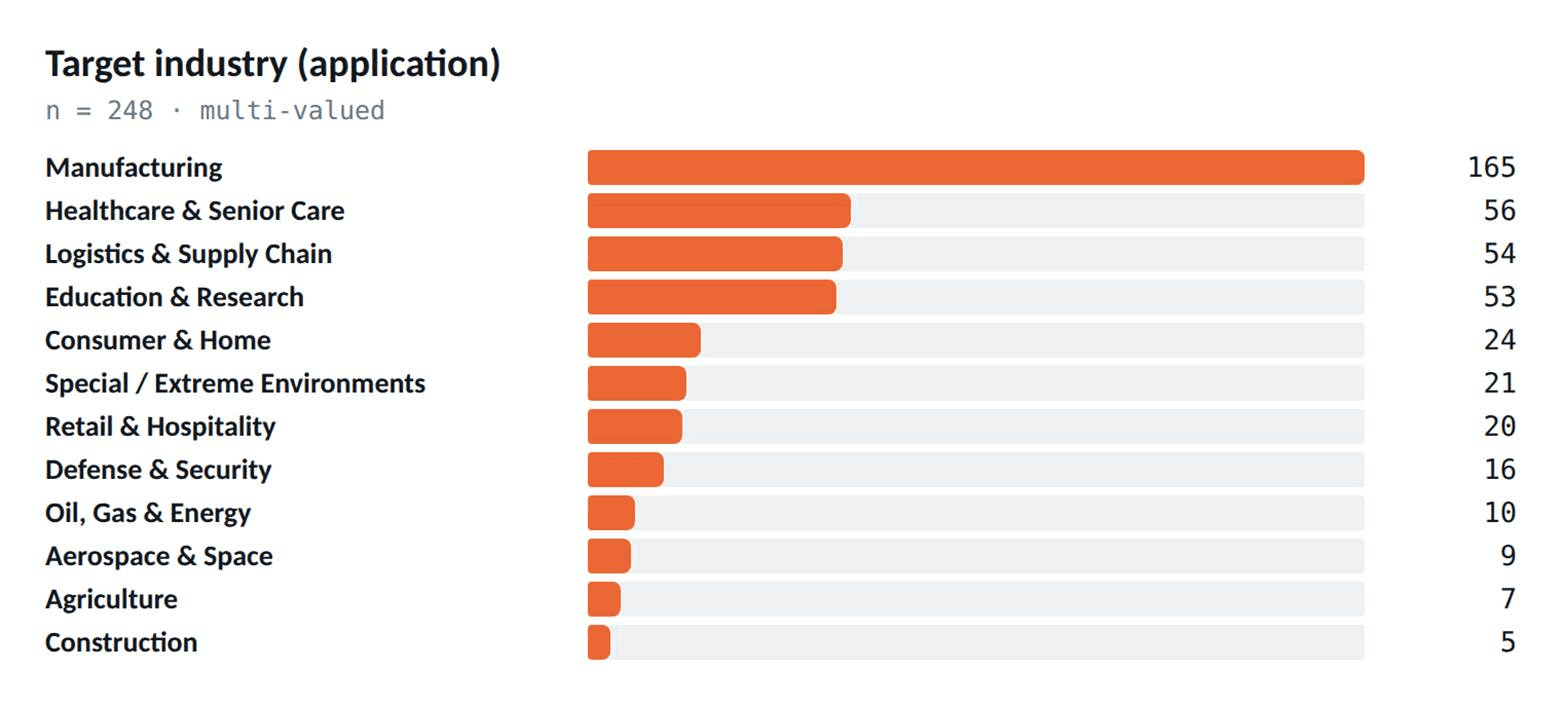
Figure 4. Target industry. Multi-valued: a company selling into several industries appears in each.
4. Humanoid and embodied AI in focus
Humanoid robotics was the theme of this edition, so the whole chain is worth mapping rather than the platform builders alone. The nine stages below regroup categories in the order a humanoid robot is assembled, from the finished platform back through its parts to the software that runs it.
4.1 The chain narrows upstream
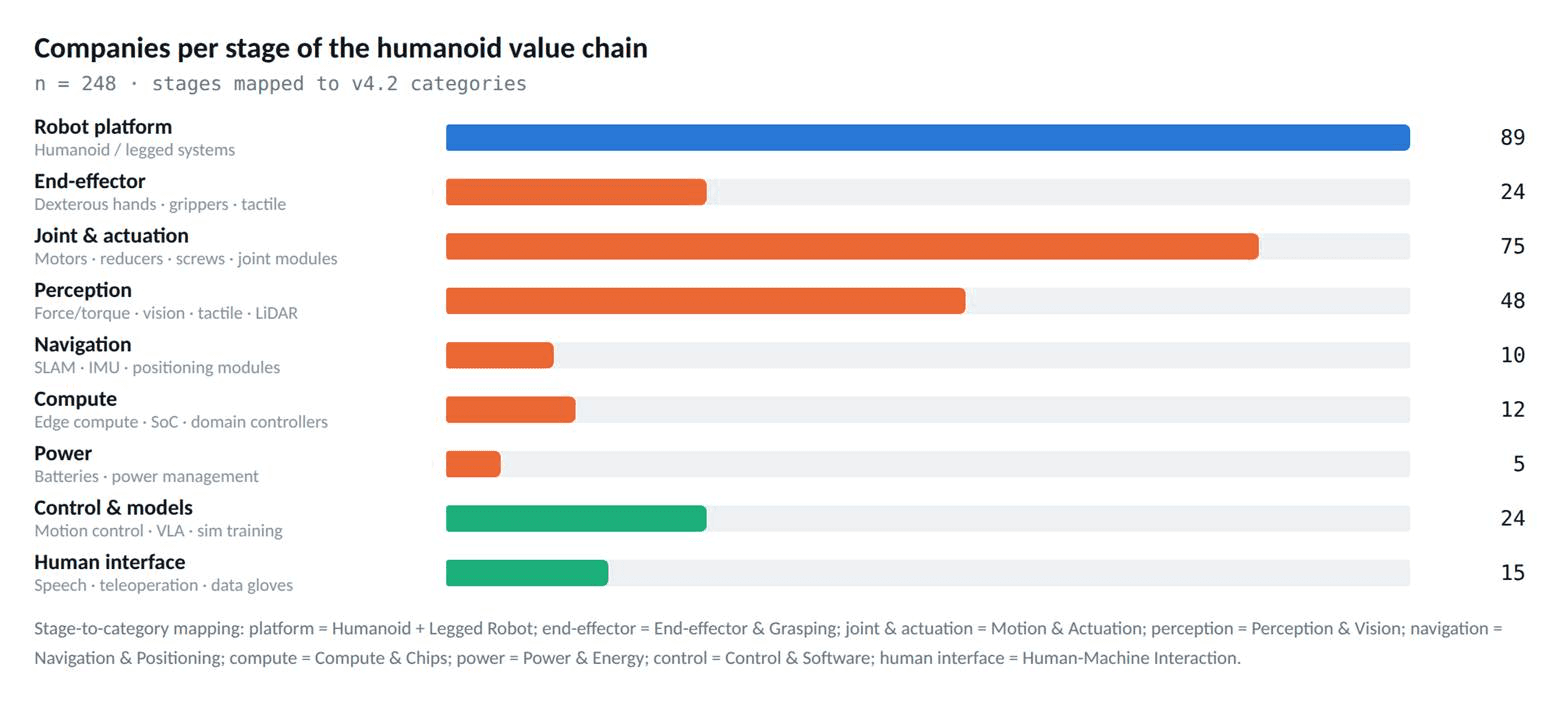
Figure 5. Companies present at each stage of the humanoid value chain. A company can appear at several stages.
89 exhibitors build humanoid or legged platforms. Behind them sit 75 joint and actuation suppliers, 48 in perception and 24 in end-effectors, which is a well-populated middle. The chain then narrows sharply: 10 exhibitors in navigation, 12 in compute, 5 in power.
The compute and power figures deserve attention. A humanoid robot is as much a power and thermal problem as a mechanical one, and very few exhibitors address that problem. The likely explanations are that these parts come from automotive and consumer-electronics suppliers who do not exhibit at robotics events, or that platform builders design them in house. On either reading, the supply constraint in Chinese humanoid production sits upstream of where most exhibitors are concentrated.
4.2 Platform builders mostly buy their parts
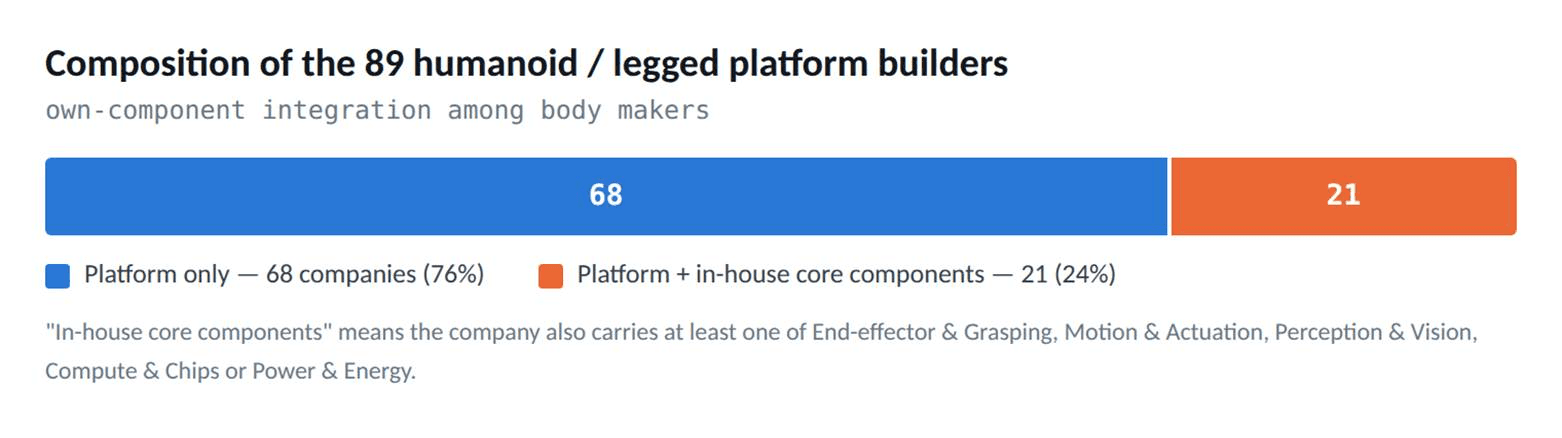
Figure 6. Whether humanoid and legged platform builders also carry a component category of their own.
68 of the 89 platform companies (76%) declare no component category. 21 integrate end-effectors, actuation, perception, compute or power in house. Vertical integration is uncommon in this sample, which is consistent with the number of joint and sensor suppliers on the floor: they supply the other two thirds.
4.3 What the secondary tags show
SubCat tags refine a company’s categories. The most frequent tags across the sample confirm the shape described above and add detail on where these robots are expected to work.
SubCat tag | Companies | Reads as |
|---|---|---|
automotive | 30 | Automotive production lines and automotive-grade parts |
quadruped | 25 | Four-legged platforms, the commercial end of legged robotics |
material-handling | 12 | Moving parts and goods inside a plant |
assembly | 12 | Assembly cells and stations |
research-platform | 11 | Robots sold to laboratories rather than to production |
stem-education | 10 | Teaching kits and classroom robots |
aged-care | 9 | Elderly-care and assistive robots |
biped | 9 | Two-legged platforms specifically |
Table 2. The eight most frequent SubCat tags in the sample.
Two of the eight, research-platform and stem-education, are not industrial end markets. Together with the 53 exhibitors targeting education and research, they indicate how much of this floor still sells to buyers who are evaluating the technology rather than depending on it.
5. Geographic distribution
Beijing and Shenzhen supply a third of the sample between them. The Yangtze River Delta contributes through several mid-sized clusters rather than one centre, and Wuhan is the largest single city outside the two leaders and Shanghai.
Headquarters city | Companies |
|---|---|
Beijing | 43 |
Shenzhen | 42 |
Shanghai | 19 |
Wuhan | 14 |
Hangzhou | 12 |
Suzhou | 9 |
Chengdu | 6 |
Kunshan | 5 |
Changzhou | 5 |
Wuxi | 5 |
Dongguan | 4 |
Shaoxing | 4 |
Table 3. Top headquarters cities in the sample. Five companies have no verified city.
6. How to read this
Three observations follow from the distribution. Each states what the data supports rather than what is expected to happen.
Volume sits in components rather than platforms. 68 platform builders sourcing from 75 actuation suppliers and 48 perception suppliers describes a market that usually thins at the platform end before the component end.
Compute and power are the narrow links. 11 and 2 exhibitors respectively, against 89 platform builders. The suppliers meeting that demand at scale are either absent from this show or not yet established as specialists.
Demand concentrates in manufacturing and in evaluation buyers. 165 exhibitors target manufacturing, and education and research ranks fourth, just behind logistics. Consumer, construction and agriculture together account for fewer exhibitors than education alone.
One limitation applies to all three. This is a single event at a single point in time, and exhibitor lists favour companies with something new to demonstrate. The distribution describes the companies that came to Beijing in August 2026, which is a reasonable but partial view of the industry behind them.





Leave a comment